

ETF fund flows: where the money went
Investors put a net $35.1bn into ETFs in the week to Nov 3, 2026, across the 2,273 funds we track daily. SPY took in the most, $6.0bn; EWZ lost the most, $969m.
askIQ about this page
askIQ about ETF fund flows
Net flow, funds counted in each window · Six windows · dollars and share of assets at the start of each window
Funds with daily data of the 5,068 ETFs ETFIQ covers 1D 2,003 1W 2,273 1M 694 3M 635 YTD 610 1Y 605
More ↓
Windows of a month or more also show the filed months, from SEC Form N-PORT, which end in Jun 2026. The filed months leave out 74 ETFs ($4.5tn) that are one class of a fund that also has mutual fund classes, which N-PORT reports together.
ETFIQ has daily data for 2,332 of the 5,068 funds it covers, 57.0% of their assets. 2,302 more, Vanguard’s among them, have monthly data only, from SEC Form N-PORT, 42.2% of assets; the latest month filed is Aug 2026. 434 funds, 0.8% of assets, have no flows yet.
The day's ETF flows, a comparison and one number. Every trading morning. About the Daily
By category
Six windows · a total row and a coverage row| Category | 1D | 1W | 1M | 3M | YTD | 1Y | Funds counted · share of assets |
|---|---|---|---|---|---|---|---|
| Allocation | −$19.5m −0.15% · 17 funds, 17 every day | −$2.0m −0.01% · 17 funds, 17 every day | +$73.7m 0.58% · 13 funds, 13 every day | +$942m 7.8% · 13 funds, 13 every day | +$2.6bn 26.5% · 13 funds, 13 every day | +$3.1bn 33.6% · 13 funds, 13 every day | 13 of 60 · 46.2% |
| Bonds | +$3.8bn 0.29% · 314 funds, 314 every day | +$7.3bn 0.56% · 356 funds, 336 every day | +$25.7bn 2.2% · 202 funds, 202 every day | +$75.6bn 6.8% · 202 funds, 202 every day | +$190.3bn 18.5% · 182 funds, 182 every day | +$216.8bn 21.6% · 179 funds, 179 every day | 179 of 843 · 44.6% |
| Commodities | −$433m −0.16% · 36 funds, 36 every day | +$359m 0.12% · 44 funds, 41 every day | −$522m −0.19% · 9 funds, 9 every day | +$11.5bn 4.5% · 9 funds, 9 every day | +$425m 0.15% · 9 funds, 9 every day | +$9.6bn 3.8% · 9 funds, 9 every day | 9 of 68 · 82.3% |
| Stocks | +$7.6bn 0.14% · 671 funds, 671 every day | +$26.1bn 0.40% · 770 funds, 701 every day | +$34.9bn 0.67% · 331 funds, 330 every day | +$62.3bn 1.2% · 331 funds, 329 every day | +$255.8bn 5.9% · 328 funds, 326 every day | +$391.3bn 9.4% · 328 funds, 327 every day | 328 of 1,881 · 43.0% |
| Alternatives | +$22.5m 0.18% · 17 funds, 17 every day | +$178m 1.2% · 23 funds, 15 every day | +$941m 13.2% · 2 funds, 2 every day | +$2.4bn 44.4% · 2 funds, 2 every day | +$7.6bn 2 funds, 2 every day | +$12.4m 58.1% · 1 fund, 1 every day | 1 of 90 · 0.10% |
| Buffer | +$125m 0.18% · 319 funds, 319 every day | +$323m 0.42% · 315 funds, 310 every day | +$30.0m 4.4% · 8 funds, 8 every day | +$49.4m 7.5% · 8 funds, 8 every day | +$30.9m 4.9% · 8 funds, 8 every day | +$147m 28.4% · 8 funds, 8 every day | 8 of 524 · 0.80% |
| Crypto | −$567m −0.77% · 13 funds, 13 every day | −$791m −1.0% · 18 funds, 13 every day | −$1.3bn −1.6% · 3 funds, 3 every day | +$6.0bn 11.3% · 3 funds, 3 every day | +$2.9bn 3.7% · 2 funds, 2 every day | −$1.4bn −1.4% · 2 funds, 2 every day | 2 of 70 · 61.1% |
| Income | +$183m 0.13% · 207 funds, 207 every day | +$993m 0.53% · 226 funds, 204 every day | +$564m 3.7% · 80 funds, 79 every day | +$498m 10.3% · 21 funds, 21 every day | +$1.5bn 41.1% · 20 funds, 20 every day | +$1.8bn 52.3% · 19 funds, 19 every day | 19 of 377 · 2.4% |
| Leverage | +$108m 0.12% · 241 funds, 241 every day | +$949m 0.55% · 338 funds, 240 every day | · no daily data | · no daily data | · no daily data | · no daily data | 0 of 726 · 0.00% |
| Themes | −$68.1m −0.02% · 168 funds, 168 every day | −$384m −0.14% · 166 funds, 152 every day | +$5.1bn 2.9% · 46 funds, 46 every day | +$2.5bn 1.5% · 46 funds, 46 every day | +$35.6bn 32.6% · 46 funds, 46 every day | +$39.4bn 37.2% · 46 funds, 46 every day | 46 of 427 · 32.9% |
| Total, funds with daily data | +$10.7bn 0.14% | +$35.1bn 0.39% | +$65.4bn 0.95% | +$161.8bn 2.4% | +$496.8bn 8.6% | +$660.8bn 11.7% | 605 of 5,068 |
| Coverage | Each cell: net flow in dollars, and as a share of the group’s net assets at the start of the window. Funds with monthly data only are not in these cells.More ↓A fund that holds other ETFs is counted in its own group and in the total, and is not separated out here, so a fund of funds and the funds it holds can both carry the same money. A share is left out where the funds it is computed on moved money the other way from the number beside it, or where it passes 100%, because the group is then measured on a few funds rather than on itself. Each cell’s second line is the share of that group’s net assets, then how many of its funds the number sums, and how many of those have data for every trading day in the window. A window none of a group’s funds covers has no daily data, never $0. | ||||||
Biggest moves · 1 day
Nov 3, 2026 · by dollars, then by share of assetsA fund whose numbers end before Nov 3, 2026 shows the day they reach under its number. The share lists rank funds with at least $100m of net assets at the close of Nov 2, 2026 and leave out the 815 smaller ones.
Show all 25 →
Show all 25 →
Show all 124 →
Biggest moves · 1 week
Oct 28 to Nov 3, 2026 · by dollars, then by share of assetsA fund whose numbers end before Nov 3, 2026 shows the day they reach under its number. The share lists rank funds with at least $100m of net assets at the close of Oct 27, 2026 and leave out the 822 smaller ones.
Show all 25 →
Show all 25 →
Biggest moves · 1 month
Oct 5 to Nov 3, 2026 · by dollars, then by share of assetsA fund whose numbers end before Nov 3, 2026 shows the day they reach under its number. The share lists rank funds with at least $100m of net assets at the close of Oct 2, 2026 and leave out the 167 smaller ones.
Show all 25 →
Show all 25 →
Biggest moves · 3 months
Aug 4 to Nov 3, 2026 · by dollars, then by share of assetsA fund whose numbers end before Nov 3, 2026 shows the day they reach under its number. The share lists rank funds with at least $100m of net assets at the close of Aug 3, 2026 and leave out the 137 smaller ones.
Show all 25 →
Show all 25 →
Biggest moves · year to date
Jan 2 to Nov 3, 2026 · by dollars, then by share of assetsA fund whose numbers end before Nov 3, 2026 shows the day they reach under its number. The share lists rank funds with at least $100m of net assets at the close of Dec 31, 2025 and leave out the 139 smaller ones.
Show all 25 →
Show all 25 →
Biggest moves · 1 year
Nov 4, 2025 to Nov 3, 2026 · by dollars, then by share of assetsA fund whose numbers end before Nov 3, 2026 shows the day they reach under its number. The share lists rank funds with at least $100m of net assets at the close of Nov 3, 2025 and leave out the 137 smaller ones.
Show all 25 →
Show all 25 →
Issuers
Funds counted, six windows, basisThe 12 largest houses by funds counted, with the basis each house’s numbers are on. Every house is on the issuers index.
| Issuer | Funds counted | 1D | 1W | 1M | 3M | YTD | 1Y | Basis |
|---|---|---|---|---|---|---|---|---|
| iShares | 457 | +$6.7bn 0.15% · 455 funds | +$14.6bn 0.32% · 457 funds | +$44.7bn 0.96% · 456 funds | +$108.8bn 2.4% · 456 funds | +$351.6bn 9.1% · 439 funds | +$464.6bn 12.5% · 434 funds | daily |
| First Trust | 306 | +$112m 0.04% · 306 funds | +$568m 0.21% · 300 funds | · no daily data | · no daily data | · no daily data | · no daily data | daily |
| Invesco | 225 | $0 136 funds | +$7.7bn 0.78% · 225 funds | · no daily data | · no daily data | · no daily data | · no daily data | daily |
| State Street | 176 | +$3.8bn 0.18% · 176 funds | +$8.6bn 0.40% · 176 funds | +$21.6bn 1.0% · 176 funds | +$47.0bn 2.2% · 176 funds | +$142.4bn 7.7% · 169 funds | +$197.6bn 11.0% · 169 funds | daily |
| Innovator | 163 | +$80.4m 0.22% · 163 funds | +$172m 162 funds | · no daily data | · no daily data | · no daily data | · no daily data | daily |
| ProShares | 151 | +$207m 0.23% · 131 funds | +$1.1bn 1.0% · 151 funds | · no daily data | · no daily data | · no daily data | · no daily data | daily |
| Direxion | 132 | −$87.3m −0.45% · 51 funds | +$38.1m 0.05% · 132 funds | · no daily data | · no daily data | · no daily data | · no daily data | daily |
| Leverage Shares | 99 | −$9.1m −0.52% · 97 funds | −$143m −6.4% · 99 funds | · no daily data | · no daily data | · no daily data | · no daily data | daily |
| Pacer | 73 | +$54.9m 0.12% · 73 funds | +$162m 0.37% · 73 funds | · no daily data | · no daily data | · no daily data | · no daily data | daily |
| JPMorgan | 71 | +$157m 0.14% · 40 funds | +$1.5bn 0.78% · 71 funds | · no daily data | · no daily data | · no daily data | · no daily data | daily |
| PGIM | 61 | +$183m 0.44% · 61 funds | +$265m 0.64% · 59 funds | · no daily data | · no daily data | · no daily data | · no daily data | daily |
| YieldMax | 61 | −$23.1m −0.26% · 60 funds | +$7.8m 0.08% · 61 funds | +$394m 3.9% · 59 funds | · no daily data | · no daily data | · no daily data | daily |
Daily and monthly bases are never summed. Each cell names the funds it sums; a window none of a house’s funds covers has no daily data, never $0.
Monthly only, from SEC Form N-PORT, and so in none of the daily data above: Vanguard (115 funds), Corgi (109 funds), Global X (105 funds), GraniteShares (81 funds), WisdomTree (80 funds), Fidelity (78 funds), Defiance (74 funds), Tradr (67 funds), Franklin (59 funds), AllianzIM (56 funds), Goldman Sachs (44 funds), T-REX (39 funds), and 301 more houses; the method lists every one.
Rule. Trading days in a row with money moving the same way, counted back from Nov 3, 2026. A round trip is passed over; a day without a flow ends the run. Listed at 5 days or more, longest first.
Rule. The fund’s flow on Nov 3, 2026 ranked against its own last 250 trading days, round trips left out. Listed when it is in the top 1% either way; only funds with a flow on every one of those days.
Rule. A creation of at least 5% of a fund’s net assets and $100m, undone within 5 trading days by a redemption of 80% to 125% of the same shares, both in whole creation units. Both legs stay in every total; the rankings leave them out.
Segments
85 · six windows to Nov 3, 2026Each chip is a segment’s net flow in the month to Nov 3, 2026, summed over its funds with daily data: the 6 that took in the most and the 6 that lost the most.
More ↓
The table has all 85, with the funds each number counts.
The 85-row table →
| Segment | 1D | 1W | 1M | 3M | YTD | 1Y | Funds counted · share of assets |
|---|---|---|---|---|---|---|---|
| U.S. large-cap value | +$188m | +$518m round trips −$5.8m | +$413m 0.13% | +$2.6bn 0.81% | −$5.3bn −1.8% round trips +$1.4bn | +$7.7bn 2.9% round trips +$1.5bn | 17 of 148 · 34.0% |
| U.S. large-cap blend | +$5.8bn | +$11.3bn | +$16.2bn | +$16.5bn | +$115.9bn round trips +$23.2m | +$168.8bn round trips −$139m | 45 of 333 · 48.1% |
| U.S. large-cap growth | +$131m | +$7.0bn | +$2.2bn 0.67% | +$4.7bn 1.6% round trips +$22.7m | +$6.1bn 2.2% round trips +$35.2m | +$8.6bn 3.0% round trips −$299m | 9 of 139 · 21.9% |
| U.S. mid-cap value | −$20.0m | +$915m round trips −$31.2m | −$788m −1.1% round trips −$31.2m | −$583m −0.76% round trips −$31.2m | −$2.5bn −3.6% round trips +$83.1m | −$1.8bn −2.7% round trips +$76.6m | 8 of 111 · 25.5% |
| U.S. mid-cap blend | +$10.9m | +$777m | +$2.5bn 0.93% | +$8.5bn 3.2% | +$18.8bn 8.4% round trips −$43.7m | +$22.9bn 10.6% round trips −$59.8m | 19 of 113 · 52.2% |
| U.S. mid-cap growth | +$19.5m | −$7.3m −0.03% | +$10.5m 0.05% | −$518m −2.2% | −$1.4bn −5.8% | −$954m −4.0% | 3 of 32 · 45.9% |
| U.S. small-cap value | +$49.2m | +$458m | +$20.6m 0.08% | +$92.7m 0.32% | −$159m −0.66% round trips −$31.6m | +$261m 1.1% round trips −$31.6m | 6 of 58 · 22.3% |
| U.S. small-cap blend | +$314m | +$896m | −$3.0bn −1.3% | −$600m −0.26% | −$1.6bn −0.85% round trips +$3.0m | +$5.1bn 2.8% round trips +$2.4m | 13 of 89 · 55.3% |
| U.S. small-cap growth | −$17.4m | +$38.4m | −$13.4m −0.09% | +$524m 3.6% | −$416m −3.1% | −$164m −1.2% | 1 of 21 · 34.6% |
| Communications | −$186m | −$72.0m −0.32% | +$577m 2.5% | +$965m 4.1% | −$2.3bn −8.2% | −$2.1bn −7.8% round trips −$40.7m | 2 of 7 · 74.8% |
| Consumer cyclical | −$69.9m | −$42.4m −0.15% | −$356m −1.3% | +$56.3m 0.20% | −$2.1bn −6.6% round trips −$6.5m | −$2.4bn −7.5% round trips +$30.4m | 6 of 13 · 77.9% |
| Consumer defensive | −$114m | +$203m 1.2% | −$32.3m −0.20% | −$276m −1.6% round trips +$103m | −$1.4bn −8.6% round trips +$103m | −$2.5bn −14.4% round trips +$103m | 3 of 12 · 63.7% |
| Energy | −$297m | +$58.0m | +$1.9bn 3.7% | +$294m 0.60% | +$6.1bn 19.0% round trips −$55.2m | +$33.6bn 104.7% round trips −$55.2m | 8 of 32 · 66.5% |
| Financials | +$342m | +$1.0bn 1.4% | +$550m 0.84% round trips −$50.1m | −$5.2bn −6.8% round trips −$50.1m | −$2.2bn round trips −$58.9m | −$4.1bn round trips −$58.9m | 11 of 29 · 73.9% |
| Health care | +$226m | +$1.0bn | +$1.8bn 3.2% | +$2.4bn 4.6% | +$3.2bn 6.5% | +$4.7bn 10.4% | 8 of 25 · 67.2% |
| Industrials | −$259m | +$81.9m 0.22% | +$321m 0.88% | −$428m −1.1% | +$4.7bn | +$6.3bn | 5 of 10 · 77.0% |
| Materials | +$55.5m | +$212m 2.1% | +$61.6m 0.65% | +$101m 1.0% | +$2.8bn | +$7.5bn | 3 of 7 · 72.8% |
| U.S. real estate | −$2.3m | −$204m | −$502m −2.0% | −$557m −2.0% | +$235m 0.97% | +$1.8bn 7.9% | 8 of 31 · 31.9% |
| Global real estate | $0 0.00% | $0 0.00% | +$4.6m 0.32% | +$7.6m 0.48% | +$21.0m 1.5% | +$9.7m 0.68% | 3 of 12 · 19.5% |
| Technology | +$508m | +$942m 0.49% | +$1.8bn 0.99% | +$1.4bn 0.89% | +$2.5bn 1.9% round trips −$65.5m | +$805m 0.58% round trips −$71.7m | 6 of 25 · 49.1% |
| Utilities | −$203m −0.76% | −$244m −0.91% | −$739m −3.0% | +$1.2bn 4.8% | +$1.5bn | +$1.9bn | 3 of 8 · 66.7% |
| International large-cap value | $0 | +$147m round trips +$13.0m | −$122m −0.30% | +$1.8bn 4.6% | +$656m | +$472m | 4 of 49 · 22.0% |
| International large-cap blend | +$824m | +$924m | +$5.0bn 1.0% | +$21.2bn 4.5% | +$50.6bn | +$58.6bn | 20 of 111 · 41.7% |
| International large-cap growth | $0 | +$13.9m 0.07% | +$104m 0.63% | −$1.2bn −6.9% | +$5.1bn | +$4.9bn | 2 of 21 · 72.2% |
| International small and mid-cap value | +$18.8m 0.09% | +$57.4m 0.28% | +$2.1m 0.52% | +$4.2m 1.0% | +$236m | +$237m | 2 of 10 · 1.4% |
| International small and mid-cap blend | −$1.3m −0.01% | −$857k −0.01% | +$286m 2.0% | −$197m −1.3% round trips −$224k | −$551m round trips −$224k | +$644m round trips −$224k | 4 of 15 · 36.8% |
| Global large-cap value | $0 0.00% | +$8.2m 0.40% | +$6.9m 0.34% | +$136m 7.2% | +$729m | +$775m | 2 of 19 · 15.1% |
| Global large-cap blend | +$143m | +$454m | +$1.2bn 2.4% | +$1.1bn 2.4% | +$6.2bn | +$7.9bn | 16 of 55 · 31.1% |
| Global large-cap growth | $0 0.00% | −$2.7m | +$6.4m 1.9% | +$38.5m 12.8% | +$106m 50.8% | +$106m 51.4% | 1 of 22 · 1.9% |
| Global small and mid-cap | +$6.8m | −$1.3m −0.05% | +$6.8m 0.73% | +$27.1m 2.9% | −$169m −16.7% | −$151m −15.4% | 2 of 24 · 12.9% |
| Emerging markets | +$116m | +$398m | +$2.2bn 0.87% | +$3.9bn 1.6% | +$26.1bn 14.1% | +$34.2bn 19.1% | 18 of 105 · 50.3% |
| Asia-Pacific | $0 0.00% | +$16.5m 0.61% | +$8.1m 0.29% | +$34.0m 1.3% | +$227m 10.5% | +$475m 24.0% | 1 of 3 · 24.1% |
| Asia-Pacific excluding Japan | −$4.4m | +$11.5m | +$124m 0.97% | +$116m 0.96% | +$1.4bn 15.5% | +$1.5bn 17.6% | 7 of 21 · 57.5% |
| Europe | +$97.0m 0.18% | +$49.2m 0.07% | −$609m −1.1% | +$1.9bn 3.6% | +$4.9bn 10.5% | +$5.5bn 12.6% | 26 of 70 · 52.3% |
| Latin America | $0 0.00% | −$978m −5.6% | +$2.8bn 17.7% | +$1.9bn 11.8% | +$4.7bn 38.4% | +$5.4bn 48.2% | 5 of 12 · 93.9% |
| China region | −$261m | −$401m | −$460m −1.9% | −$430m −1.8% | −$2.3bn −10.3% | −$2.1bn −8.9% | 8 of 25 · 71.4% |
| India | +$45.3m 0.63% | +$44.0m 0.62% | −$37.3m −0.54% | −$461m −5.8% | −$2.6bn −23.8% | −$2.6bn −23.8% | 3 of 18 · 57.0% |
| Japan | +$221m 0.50% | +$417m | +$1.2bn 4.5% | +$1.7bn 7.2% | +$6.0bn 35.4% | +$6.4bn 37.3% | 5 of 20 · 44.2% |
| Single country or narrow region | −$49.0m | +$90.6m | +$490m 1.2% | −$590m −1.6% | +$12.0bn 69.7% | +$13.2bn 82.8% | 15 of 26 · 69.1% |
| Cash and ultrashort | +$1.8bn | −$1.0bn | −$487m −0.21% | +$22.0bn 10.4% | +$60.3bn 34.8% | +$72.5bn 45.0% | 17 of 77 · 53.0% |
| Short-term bond | +$66.7m | +$89.0m | +$1.0bn 1.4% | +$2.8bn 4.0% | +$12.8bn 21.1% | +$14.3bn 24.2% | 17 of 73 · 34.7% |
| Intermediate core bond | −$491m −0.31% | −$484m | +$714m 0.47% | +$4.4bn 2.9% | +$11.2bn 7.5% | +$12.4bn 8.3% | 4 of 33 · 37.0% |
| Intermediate core-plus bond | +$75.9m | +$462m 0.57% | +$1.4bn 2.7% | +$8.2bn 17.7% | +$19.3bn 53.4% | +$21.4bn 62.8% | 5 of 37 · 37.0% |
| Long-term bond | −$6.3m −0.14% | +$23.5m 0.53% | +$22.2m 0.52% | −$48.8m −1.1% | +$332m 7.4% | +$678m 16.2% | 3 of 8 · 23.6% |
| Short-term government | +$116m | +$199m 0.35% | +$1.2bn 2.1% | +$4.4bn 8.1% | +$8.3bn 16.3% | +$9.3bn 18.6% | 8 of 21 · 52.8% |
| Intermediate-term government | +$125m | +$909m 0.90% | +$4.2bn 4.4% | −$78.3m −0.08% | +$16.3bn | +$22.6bn | 9 of 29 · 64.0% |
| Long-term government | +$899m | +$1.4bn 1.9% | +$242m 0.35% | +$10.0bn 15.8% | +$5.8bn 8.1% | +$3.8bn 5.0% | 8 of 27 · 77.3% |
| Government mortgage-backed | −$33.7m | +$152m 0.30% | −$514m −1.2% | −$1.8bn −4.0% | −$1.1bn −2.4% | −$3.5bn −7.2% | 3 of 16 · 49.2% |
| Inflation-protected | +$17.4m 0.10% | +$21.1m 0.12% | +$318m 1.8% | +$564m 3.2% | +$2.1bn 12.3% | +$2.0bn 11.9% | 8 of 16 · 49.1% |
| Short-term inflation-protected | +$5.1m | +$56.5m | +$398m 2.3% | +$1.3bn 8.0% | +$4.8bn 36.8% | +$4.5bn 33.8% | 6 of 19 · 40.5% |
| Corporate bond | +$794m | +$2.5bn | +$6.4bn 8.7% | +$4.2bn 5.4% | +$12.7bn 17.4% | +$12.0bn 16.3% | 17 of 70 · 43.2% |
| High yield | +$283m | +$1.8bn | +$1.6bn 2.0% | +$738m 0.88% | +$2.6bn | +$3.9bn | 21 of 100 · 68.6% |
| Bank loans | $0 0.00% | +$128m 0.82% | −$189m −3.5% | −$113m −2.1% | −$1.2bn −18.5% | −$1.2bn −18.1% | 2 of 15 · 26.7% |
| Multisector bond | $0 | −$1.2m −0.54% | −$17.3m −10.7% | +$29.2m 24.7% | +$3.3m 2.2% | +$74.7m 100.1% | 2 of 17 · 2.7% |
| Preferred stock | −$22.6m −0.11% | −$105m | −$229m −1.8% | −$714m −5.1% | −$1.4bn −9.6% | −$1.8bn −11.7% | 2 of 23 · 32.8% |
| Convertibles | −$75.7m −0.60% | −$237m −1.8% | −$98.9m −0.72% | +$854m 6.6% | +$3.8bn 45.0% | +$4.5bn 54.6% | 2 of 5 · 98.8% |
| Securitized, diversified | +$9.8m | +$39.1m | +$113m 15.0% | −$35.7m −3.9% | · | · | 0 of 21 · 0.00% |
| Securitized, focused | +$176m | +$333m | +$470m 16.4% | +$591m 21.4% | +$1.4bn 72.8% | +$1.4bn 67.9% | 3 of 37 · 5.6% |
| Global bond | $0 | −$282m −3.9% | −$296m −6.4% | −$350m −7.2% | +$578m 14.3% | +$431m 10.3% | 6 of 15 · 23.6% |
| Global bond, dollar-hedged | +$7.1m 0.04% | +$270m 1.6% | +$492m 3.0% | +$2.9bn 20.2% | +$6.2bn 55.3% | +$6.6bn 59.8% | 2 of 5 · 16.6% |
| Emerging-markets bond | $0 | +$340m 2.2% | +$627m 4.6% | −$659m −4.2% | −$2.3bn −12.9% | −$520m −3.3% | 5 of 18 · 60.5% |
| Emerging-markets local-currency bond | $0 0.00% | +$12.3m 0.36% | +$58.4m 2.0% | +$107m 3.6% | +$243m 8.5% | +$459m 17.4% | 2 of 6 · 35.7% |
| Multisector bond, flexible credit | +$2.5m 0.02% | +$58.2m 0.35% | +$438m 2.7% | +$1.2bn 7.2% | +$2.4bn 15.8% | +$3.9bn 28.2% | 1 of 1 · 100.0% |
| Municipal, national, short | +$6.5m | +$234m 0.73% | +$1.3bn 6.5% | +$2.3bn 12.4% | +$3.7bn 20.9% | +$4.4bn 26.0% | 14 of 41 · 49.2% |
| Municipal, national, intermediate | +$7.5m | +$66.9m 3.2% | +$153m 17.0% | +$358m 49.9% | +$689m 205.0% | +$759m 285.1% | 3 of 29 · 4.0% |
| Municipal, national, long | +$14.8m | +$213m | +$5.3bn 10.2% | +$9.9bn 19.8% | +$15.9bn 35.8% | +$16.4bn 37.1% | 3 of 45 · 40.8% |
| Municipal high yield | +$2.8m | +$79.7m 0.88% | +$351m 5.0% | +$1.2bn 19.2% | +$2.1bn 36.2% | +$2.3bn 42.7% | 3 of 13 · 40.3% |
| Municipal, single state, short | $0 0.00% | +$20.1m 3.0% | +$125m 22.4% | +$240m 53.7% | +$474m 221.5% | +$515m 295.8% | 1 of 2 · 35.7% |
| Municipal, California, intermediate | · | · | · | · | · | · | 0 of 3 · 0.00% |
| Municipal, California, long | +$13.9m 0.25% | +$42.1m 0.62% | +$427m 8.9% | +$854m 18.6% | +$1.7bn 45.3% | +$2.0bn 56.4% | 1 of 6 · 47.1% |
| Municipal, New York, intermediate | · | · | · | · | · | · | 0 of 2 · 0.00% |
| Municipal, New York, long | $0 0.00% | +$4.0m 0.21% | +$185m 12.1% | +$394m 28.4% | +$732m 68.5% | +$815m 82.5% | 1 of 6 · 53.6% |
| Municipal, Massachusetts | · | · | · | · | · | · | 0 of 2 · 0.00% |
| Municipal, Minnesota | · | · | · | · | · | · | 0 of 2 · 0.00% |
| Municipal, New Jersey | · | · | · | · | · | · | 0 of 1 · 0.00% |
| Municipal, Ohio | · | · | · | · | · | · | 0 of 1 · 0.00% |
| Municipal, Pennsylvania | · | · | · | · | · | · | 0 of 1 · 0.00% |
| Broad commodities | +$10.7m | +$119m | +$164m 3.9% | +$330m 9.1% | +$712m 27.7% | +$804m 31.0% | 4 of 22 · 14.9% |
| Single commodity or commodity sector | −$444m | +$240m | −$685m −0.25% | +$11.2bn 4.4% | −$287m −0.10% | +$8.8bn 3.5% | 5 of 38 · 89.8% |
| Currency | $0 | −$597k −0.03% | · | · | · | · | 0 of 8 · 0.00% |
| Conservative | $0 0.00% | −$1.1m −0.83% | +$4.3m 3.5% | +$6.5m 5.2% | +$4.3m 3.5% | +$9.6m 8.2% | 1 of 7 · 5.6% |
| Moderately conservative | −$19.5m −0.42% | −$13.5m −0.29% | −$22.1m −0.47% | +$432m 10.1% | +$1.4bn 43.0% | +$1.6bn 51.6% | 5 of 10 · 86.9% |
| Moderate | $0 0.00% | +$22.2m 0.45% | +$51.6m 1.2% | +$321m 7.7% | +$729m 20.7% | +$976m 29.7% | 4 of 29 · 29.4% |
| Moderately aggressive | $0 0.00% | −$9.6m −0.27% | +$38.2m 1.1% | +$162m 4.9% | +$411m 14.6% | +$490m 18.0% | 2 of 13 · 71.3% |
| Aggressive | $0 0.00% | $0 0.00% | +$1.6m 1.5% | +$20.3m 23.0% | +$50.0m 97.3% | +$52.1m 105.1% | 1 of 1 · 100.0% |
Themes
55 · six windows to Nov 3, 2026Each chip is a theme’s net flow in the month to Nov 3, 2026, summed over its funds with daily data: the 6 that took in the most and the 6 that lost the most.
More ↓
The table has all 55, with the funds each number counts.
The 55-row table →
| Theme | 1D | 1W | 1M | 3M | YTD | 1Y | Funds counted · share of assets |
|---|---|---|---|---|---|---|---|
| 3D printing | · | · | · | · | · | · | 0 of 1 · 0.00% |
| Agriculture | $0 0.00% | −$156m −24.3% | $0 0.00% | +$21.7m 14.8% | +$70.4m 82.9% | +$70.4m 82.9% | 1 of 6 · 10.5% |
| AI infrastructure and chips | · | · | · | · | · | · | 0 of 11 · 0.00% |
| AI labs and single company AI | $0 | +$10.0m | · | · | · | · | 0 of 6 · 0.00% |
| Artificial intelligence | $0 | −$6.0m | +$132m 0.69% | −$19.7m −0.12% | +$3.1bn 30.6% | +$4.2bn 42.8% | 2 of 36 · 44.4% |
| Beauty and personal care | · | · | · | · | · | · | 0 of 1 · 0.00% |
| Biotech | −$259m −1.0% | +$318m 1.3% | +$622m 3.0% | +$1.1bn 6.0% | +$1.4bn 8.4% | +$2.9bn 22.0% round trips −$73.1m | 2 of 10 · 80.4% |
| Blockchain and crypto equities | $0 | −$8.0m | $0 0.00% | −$2.3m −2.8% | −$6.3m −7.8% | +$5.2m 4.9% | 1 of 14 · 2.3% |
| Broad innovation and megatrends | $0 | +$2.8m 0.05% | −$4.8m −0.12% | −$10.1m −0.25% | −$241m −6.6% | −$136m −3.5% | 2 of 30 · 31.0% |
| Cannabis | $0 0.00% | $0 | · | · | · | · | 0 of 5 · 0.00% |
| Clean energy | $0 | −$10.4m −0.25% | −$70.8m −2.9% | −$1.2m −0.05% | +$288m 13.8% | +$340m 15.5% | 2 of 16 · 47.0% |
| Cloud and software | −$11.7m −0.07% | −$415m −2.2% | −$712m −4.8% | −$1.9bn −12.8% | +$3.8bn 45.8% round trips −$42.1m | +$2.5bn 23.4% round trips −$42.1m | 2 of 8 · 76.8% |
| Coal | · | · | · | · | · | · | 0 of 1 · 0.00% |
| Cooling and thermal management | · | · | · | · | · | · | 0 of 1 · 0.00% |
| Copper | $0 0.00% | $0 0.00% | −$5.1m −1.1% | +$6.7m 1.6% | +$246m 141.0% | +$300m 293.4% | 1 of 6 · 5.2% |
| Cybersecurity | $0 0.00% | +$57.7m | −$4.2m −0.35% | +$18.3m 1.7% | +$18.8m 2.3% | −$13.9m −1.5% | 1 of 7 · 5.0% |
| Defense | −$43.8m −0.20% | −$144m −0.50% | −$507m −2.3% | −$498m −2.0% round trips −$28.1m | +$4.7bn 26.9% round trips +$10.6m | +$5.0bn 28.8% round trips +$18.6m | 3 of 22 · 56.4% |
| Digital infrastructure and data centers | $0 | −$17.5m −1.2% | −$11.3m −2.2% | +$188k 0.04% | +$336m 247.2% | +$340m 244.4% | 1 of 9 · 10.3% |
| Electric vehicles and batteries | $0 | −$835k −0.40% | −$128m −46.1% | +$18.9m 12.3% | −$7.1m −3.9% | −$11.9m −6.2% | 2 of 8 · 23.8% |
| Electrification and the grid | $0 0.00% | −$69.7m −0.59% | +$5.0m 1.1% | +$14.7m 3.2% | +$395m 533.9% | +$394m 478.6% | 1 of 12 · 3.2% |
| Energy security and critical technology | $0 0.00% | $0 0.00% | −$5.3m −0.73% | −$27.3m −4.0% | −$302m −32.0% | −$309m −30.5% | 1 of 5 · 72.1% |
| Energy transition and decarbonisation | $0 0.00% | +$59k | $0 0.00% | $0 0.00% | $0 0.00% | $0 0.00% | 1 of 9 · 0.40% |
| Fintech and digital payments | $0 0.00% | +$2.4m | $0 0.00% | $0 0.00% | $0 0.00% | $0 0.00% | 1 of 6 · 0.80% |
| Gaming, esports and betting | $0 | $0 | · | · | · | · | 0 of 8 · 0.00% |
| Genomics and gene editing | +$8.3m 2.5% | +$8.3m 2.5% | +$25.1m 8.1% | +$86.6m 45.3% | +$115m 88.0% | +$115m 92.3% | 1 of 4 · 13.4% |
| Gold miners | $0 0.00% | +$11.0m 0.50% | +$45.1m 2.0% | −$45.9m −2.2% | −$604m −20.7% | −$581m −24.2% | 1 of 10 · 6.5% |
| Healthcare innovation and GLP-1 | $0 0.00% | $0 | $0 0.00% | +$1.3m 11.6% | +$5.0m 69.4% | +$6.3m 111.1% | 1 of 8 · 9.3% |
| Humanoid robots | $0 0.00% | $0 0.00% | · | · | · | · | 0 of 3 · 0.00% |
| Infrastructure | −$1.2m −0.01% | −$79.1m −0.49% | −$8.3m −0.05% | −$185m −1.1% | +$2.2bn 17.4% round trips +$16.0m | +$2.7bn 22.3% round trips +$16.0m | 5 of 18 · 46.4% |
| Internet and e-commerce | −$13.2m | −$72.7m | · | · | · | · | 0 of 13 · 0.00% |
| Lithium and battery metals | −$1.3m −1.2% | −$7.2m | $0 0.00% | $0 0.00% | +$1.6m 10.7% | +$4.0m 37.3% | 1 of 5 · 0.60% |
| Longevity and aging | · | · | · | · | · | · | 0 of 2 · 0.00% |
| Memory and storage | −$81.6m −0.44% | −$64.5m −0.34% | · | · | · | · | 0 of 5 · 0.00% |
| Metaverse and immersive tech | $0 0.00% | $0 0.00% | · | · | · | · | 0 of 3 · 0.00% |
| Millennial and Gen Z consumers | · | · | · | · | · | · | 0 of 1 · 0.00% |
| Miners and metals | +$19.5m 0.33% | −$37.2m −0.61% | −$233m −3.5% | +$278m 4.6% | +$1.7bn 37.2% | +$2.2bn 59.2% | 2 of 6 · 93.2% |
| Nanotechnology | $0 0.00% | $0 0.00% | · | · | · | · | 0 of 1 · 0.00% |
| Natural resources | +$3.3m 0.04% | +$35.9m 0.51% | +$257m 3.8% | +$449m 7.2% | +$607m | +$586m | 3 of 12 · 42.1% |
| Nuclear and uranium | −$6.8m −0.22% | $0 0.00% | · | · | · | · | 0 of 10 · 0.00% |
| Pets | $0 0.00% | $0 0.00% | · | · | · | · | 0 of 1 · 0.00% |
| Photonics and optics | $0 0.00% | −$12.8m −7.9% | · | · | · | · | 0 of 3 · 0.00% |
| Quantum computing | · | · | · | · | · | · | 0 of 4 · 0.00% |
| Rare earth and critical materials | +$1.6m 0.11% | +$1.6m 2.8% | −$6.0m −18.4% | −$2.9m −10.0% | +$15.9m 140.3% | +$15.9m 142.3% | 1 of 7 · 1.4% |
| Reshoring and manufacturing | −$5.0m −0.06% | −$11.1m −0.13% | −$2.1m −3.5% | −$2.1m −3.3% | +$26.1m 92.9% | +$27.8m 108.0% | 1 of 8 · 0.60% |
| Robotics and automation | $0 0.00% | +$5.1m 37.7% | · | · | · | · | 0 of 10 · 0.00% |
| Semiconductors | +$168m 0.15% | +$158m 0.27% | +$5.6bn 10.8% | +$2.8bn 5.8% round trips +$3.7m | +$17.5bn 91.4% round trips −$32.6m | +$18.4bn 99.0% round trips −$32.6m | 2 of 11 · 38.6% |
| Shipping, aviation and logistics | $0 0.00% | $0 0.00% | · | · | · | · | 0 of 6 · 0.00% |
| Silver miners | $0 0.00% | −$8.4m | −$10.0m −1.1% | −$35.6m −4.5% | +$47.7m 5.7% | +$165m 29.8% | 1 of 4 · 9.9% |
| Space | $0 0.00% | $0 0.00% | · | · | · | · | 0 of 10 · 0.00% |
| Stablecoins and tokenisation | $0 0.00% | −$3.3m | · | · | · | · | 0 of 5 · 0.00% |
| Streaming and live entertainment | $0 0.00% | $0 0.00% | · | · | · | · | 0 of 3 · 0.00% |
| Therapeutics and medical devices | +$155m 4.1% | +$131m 3.6% | +$68.9m 2.0% | +$382m 11.4% | +$185m 4.6% | −$10.8m −0.26% | 2 of 5 · 93.7% |
| Timber and forestry | $0 | $0 0.00% | −$4.0m −1.6% | +$4.6m 1.7% | +$42.0m 18.0% | +$42.0m 18.9% | 1 of 2 · 89.3% |
| Travel and leisure | $0 0.00% | +$664k | · | · | · | · | 0 of 3 · 0.00% |
| Water | $0 | −$2.2m −0.04% | · | · | · | · | 0 of 6 · 0.00% |
Monthly total net flow since Jul 2019
Period by group
More ↓
Fills for shares between 0.63% and 0.76% (money in) or 0.70% and 0.85% (money out) of a group’s assets are drawn one step lighter or darker, so the number in the cell stays readable.
Embed this chart
Free to use with the credit link. Paste this where the chart should go; it updates every trading night.
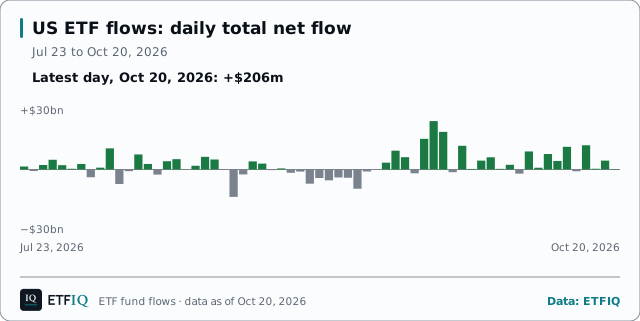
<figure style="margin:0;max-width:640px">
<iframe src="https://etfiq.com/embed/flows/daily-net-flow/" title="Daily total net flow, Aug 6 to Nov 3, 2026. Latest day, Nov 3, 2026: +$16.1bn." width="640" height="351" loading="lazy" style="border:0;max-width:100%;width:100%"></iframe>
<figcaption style="font:13px/1.5 sans-serif">Daily total net flow, Aug 6 to Nov 3, 2026. Latest day, Nov 3, 2026: +$16.1bn. Data: <a href="https://etfiq.com/flows/">ETFIQ</a></figcaption>
</figure>Cumulative net flow by group
Year to date, $bn · one line per groupEvery fund, A to Z
Every one of the 2,332 funds with daily data, A to Z.All 2,332 funds, A to Z
A fund’s flow on a day is the change in its shares outstanding times the previous day’s net asset value per share, because shares counted on a day were created or redeemed at the previous day’s value.
Method →Questions people ask
- Which ETFs had the biggest inflows this week?
- SPY took in $6.0bn in the week to Nov 3, 2026, the most of 2,273 ETFs counted all week. Next were QQQ, $5.7bn, and IVV, $4.3bn.
- Which ETFs had the biggest outflows this week?
- EWZ lost $969m in the week to Nov 3, 2026, the most of 2,273 ETFs counted all week. Next were GLD, $505m, and DIA, $494m.
- Which ETF issuers took in the most this month?
- iShares took in $44.7bn across 456 funds in the month to Nov 3, 2026. That is the most of 3 issuers with funds counted all month. Next were State Street, $21.6bn across 176 funds, and YieldMax, $394m across 59 funds.
Links are sources, not endorsements.
Cite this pageCitation, APA and Markdown
ETFIQ, ETF fund flows, data as of Nov 3, 2026. https://etfiq.com/flows/
Free to use with attribution for ETFIQ’s data. Not investment advice.
Cite this page. ETFIQ, ETF fund flows, data as of Nov 3, 2026. https://etfiq.com/flows/ Free to use with attribution; the underlying files are at Open data.
- Plain
- ETFIQ, ETF fund flows, data as of Nov 3, 2026. https://etfiq.com/flows/
- APA
- ETFIQ. (Nov 3, 2026). ETF fund flows. Retrieved from https://etfiq.com/flows/
- Markdown
- [ETF fund flows (ETFIQ, Nov 3, 2026)](https://etfiq.com/flows/)