

Data as of Nov 4, 2026.
Biotech ETFs: what each one holds
See every biotech ETF by what it holds, not by its name. Funds that hold drug developers, usually a broad basket of them rather than one field. 10 funds, largest first. Updated Nov 4, 2026. The typical fund carries 32% of its weight in S&P 500 stocks, the 24th most of the 54 themes with holdings on file.
askIQ about this page
askIQ about Biotech ETFs
What these funds actually own
Between them the 9 funds' ten largest holdings name 48 companies, of which 13 appear in more than one.More
AMGEN INC is among the ten largest of 7 of them, at an average of 6.9% of the fund.
Biotech ETFs, the companies their ten largest holdings name. The 15 most widely held of 48. Source: each fund's latest SEC filing or its issuer’s own daily holdings file, read by ETFIQ.
How this is counted
Each row counts the ten largest holdings of each fund, so a fund missing from a row may still hold that company lower down. Weights are of the funds that name it, not of the theme.
Share of each fund's weight in S&P 500 companies. Above half, the fund is mostly the S&P 500.
Dark line: the S&P 500 over the same days, +14.8%. Last column: the gap to each fund's own benchmark, in points.
The 10 largest biotech ETFs
ETFIQ covers 10 biotech ETFs. The largest are IBB ($11.2bn), XBI ($10.6bn) and FBT ($3.1bn); fees run 0.13% to 0.65%, as of .
- 1IBB$11.2bn0.44%iShares Biotechnology ETF
- 2XBI$10.6bn0.35%State Street SPDR S&P Biotech ETF
- 3FBT$3.1bn0.55%First Trust NYSE Arca Biotechnology Index Fund
- 4PBPH$952m0.13%Portfolio Building Block World Pharma and Biotech Index ETF
- 5BBH$525m0.35%VanEck Biotech ETF
- 6PBE$442m0.59%Invesco Biotechnology & Genome ETF
- 7IBBQ$121m0.19%Invesco Nasdaq Biotechnology ETF
- 8BBP$99m0.34%Virtus Biotech ETF
- 9BBC$46m0.65%Virtus Biotech Clinical Trials ETF
- 10TDNA$11m0.55%T. Rowe Price Biotech ETF
Every biotech ETF, largest first
Click a column to sort| Ticker | Fund | Issuer | Net assets ↓ | In the S&P 500 | Active share | Total return 1Y | vs its benchmark 1Y | Fee |
|---|---|---|---|---|---|---|---|---|
| IBB | iShares Biotechnology ETF | iShares | $11.2bn | 42.0% | 99.0% | +42.0% | not measured | 0.44% |
| XBI | State Street SPDR S&P Biotech ETF | State Street | $10.6bn | 13.9% | 98.4% | +47.9% | not measured | 0.35% |
| FBT | First Trust NYSE Arca Biotechnology Index Fund | First Trust | $3.1bn | 24.8% | 99.1% | +47.0% | not measured | 0.55% |
| PBPH | Portfolio Building Block World Pharma and Biotech Index ETF | Portfolio Building Block | $952m | 59.2% | 95.0% | first traded 344 days ago | · | 0.13% |
| BBH | VanEck Biotech ETF | VanEck | $525m | 64.4% | 99.0% | +47.2% | not measured | 0.35% |
| PBE | Invesco Biotechnology & Genome ETF | Invesco | $442m | 32.3% | 99.0% | +44.2% | not measured | 0.59% |
| IBBQ | Invesco Nasdaq Biotechnology ETF | Invesco | $121m | 42.5% | 99.0% | +42.7% | not measured | 0.19% |
| BBP | Virtus Biotech ETF | Virtus | $99m | 10.5% | 99.0% | +44.4% | not measured | 0.34% |
| BBC | Virtus Biotech Clinical Trials ETF | Virtus | $46m | 0.0% | 100.0% | +45.9% | not measured | 0.65% |
| TDNA | T. Rowe Price Biotech ETF | T. Rowe Price | $11m | not yet filed | not yet filed | first traded 48 days ago | · | 0.55% |
How much of each pair is the same fund
The closest pair is IBB and IBBQ, which hold 85% of their weight in the same companies. The furthest apart is BBC and FBT at 0%. The middle pair of the 36 is 28%. The grid is the 9 largest of 10 funds.
Biotech ETFs, the share of each pair’s weight held in the same companies. Read across or down; the number is the same either way. Cells are shaded against the closest pair here, 85%. Source: each fund’s own filed or daily holdings, read by ETFIQ.
How to read the grid
Weight overlap adds the smaller of the two weights for every company both funds hold. Funds with a cut-short book are left out, not compared short.
What each fund holds alone
Biotech ETFs, the largest holding no other fund in the grid holds. Source: ETFIQ.
Questions people ask
- How many biotech ETFs are there?
- ETFIQ covers 10 US listed biotech ETFs as of Nov 4, 2026. That is every one it can measure from the fund’s own published holdings.
- What is the largest biotech ETF?
- IBB, iShares Biotechnology ETF, at $11.2bn in net assets as of Nov 3, 2026, the largest of the 10 biotech ETFs with a published size.
- What is the cheapest biotech ETF?
- PBPH, Portfolio Building Block World Pharma and Biotech Index ETF, at 0.13% a year by its prospectus filed Oct 27, 2025, the lowest fee of the 10 biotech ETFs that publish one.
- Which biotech ETF has performed best over the past year?
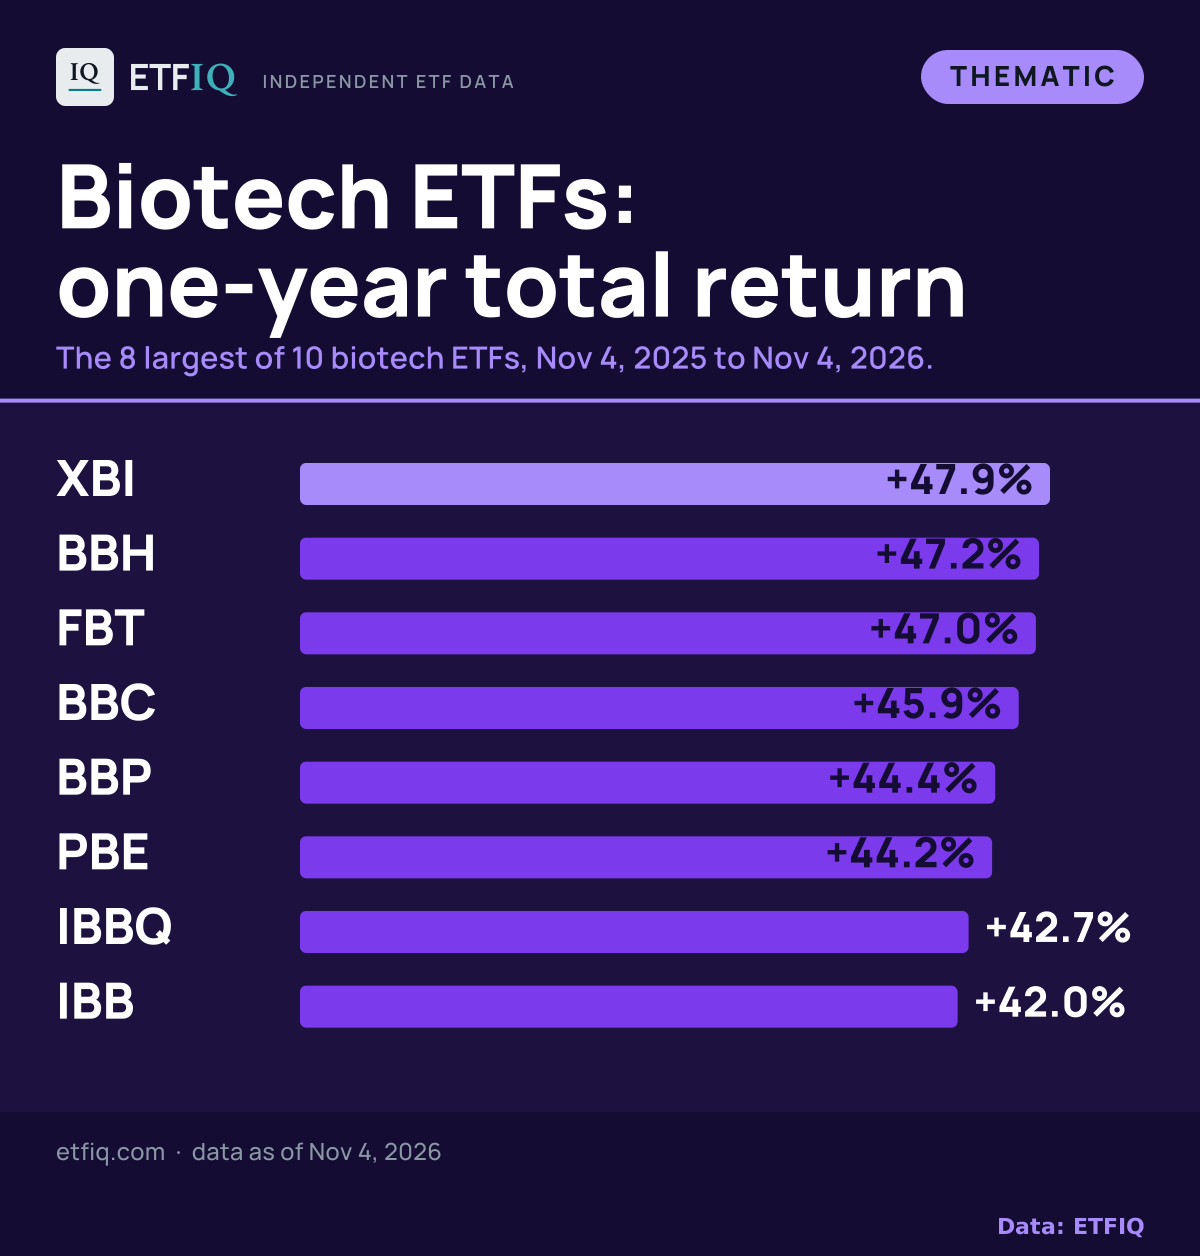
- XBI, State Street SPDR S&P Biotech ETF, at +47.9% total return over the year to Nov 4, 2026, the highest of the 8 biotech ETFs with a full year of trading behind them. Past returns do not predict future ones.
- What do biotech ETFs hold?
- Funds that hold drug developers, usually a broad basket of them rather than one field. Between them the 9 biotech ETFs ETFIQ can read name 48 companies in their ten largest holdings, by holdings dated Jul 31, 2026 to Nov 3, 2026, most widely AMGEN INC, which is among the ten largest of 7 of them.
- Do biotech ETFs hold the same companies?
- It depends which two. Across the 36 pairs of the 9 biotech ETFs with a full published book, by holdings dated Jul 31, 2026 to Nov 3, 2026, IBB and IBBQ hold 85% of their weight in the same companies, BBC and FBT hold 0%, and the middle pair holds 28%. Two funds sold on one theme are not the same fund.
What the issuers say about this theme
About these links
The issuers behind these biotech funds publish their own work on this theme. These are their pages and words, not ETFIQ’s. A fund company writing about a theme it sells is making a case.
Issuer material on this theme. Links leave ETFIQ. Source: each issuer’s own site.
Links are sources, not endorsements. Standards and sources →
Embed this chart
Free to use with the credit link. Paste this where the chart should go; it updates every trading night.
<figure style="margin:0;max-width:640px">
<iframe src="https://etfiq.com/embed/theme/biotech/" title="Biotech ETFs, one-year total return to Nov 4, 2026: XBI +47.9%, BBH +47.2%, FBT +47.0%, BBC +45.9%, BBP +44.4%, PBE +44.2%, IBBQ +42.7%, IBB +42.0%." width="640" height="700" loading="lazy" style="border:0;max-width:100%;width:100%"></iframe>
<figcaption style="font:13px/1.5 sans-serif">Biotech ETFs, one-year total return to Nov 4, 2026: XBI +47.9%, BBH +47.2%, FBT +47.0%, BBC +45.9%, BBP +44.4%, PBE +44.2%, IBBQ +42.7%, IBB +42.0%. Data: <a href="https://etfiq.com/themes/biotech">ETFIQ</a></figcaption>
</figure>Cite this pageCitation, APA and Markdown
ETFIQ, Biotech ETFs: what each one holds, data as of Nov 4, 2026. https://etfiq.com/themes/biotech
ETFIQ. (Nov 4, 2026). Biotech ETFs: what each one holds. Retrieved from https://etfiq.com/themes/biotech
[Biotech ETFs: what each one holds (ETFIQ, Nov 4, 2026)](https://etfiq.com/themes/biotech)
Free to use with attribution for data ETFIQ computes; issuer data stays under its owner's terms. The underlying files are at Open data.