


WANT Direxion Daily Consumer Discretionary Bull 3X ETF
Share ▾
Embed ▾
Free to use with the credit link. It updates every trading night.
Fund card
<iframe src="https://etfiq.com/embed/fund/want/" title="ETFIQ WANT analysis" width="100%" height="420" loading="lazy" style="border:0;max-width:600px"></iframe>
<p>Data: <a href="https://etfiq.com/funds/want">ETFIQ WANT analysis</a></p>
Daily flows
<iframe src="https://etfiq.com/embed/flows-strip/want/" title="ETFIQ WANT fund flows" width="100%" height="340" loading="lazy" style="border:0;max-width:600px"></iframe>
<p>Data: <a href="https://etfiq.com/funds/want">ETFIQ WANT fund flows</a></p>Over the three months to Nov 13, 2026, WANT lost 0.5%, against 2.2% for three times XLY's daily moves.
- 1-year total return
- −9.0%XLY +4.3% to Nov 13, 2026
- Expense ratio
- 1.00%a year
- Net assets
- $21mon Nov 12, 2026
- Net flow, last 5 trading days
- $0daily basis to Nov 12, 2026
Did what it promises: YesOver three months to Nov 13, 2026, WANT finished 2.7 points behind three times XLY's daily moves, compounded.
WANT vs XLY, 1 year
Total return, distributions reinvested, Nov 13, 2025 to Nov 13, 2026.
WANT risk and return scorecard
vs XLY · Dec 2018 to Nov 2026 · 414 weekly returns · dividend-adjusted
Computed by ETFIQ from Tiingo daily prices and ETFIQ's distribution records; risk-free rate: U.S. Treasury, Daily Treasury Bill Rates, 13-week coupon equivalent Method · Data
Money in and out
What you earned
At WANT’s 1% a year, taken each year from the amount after growth. Hypothetical.
Did it deliver its multiple?
10 committee seats read WANT on data as of Nov 13, 2026: 0 Supports, 2 Mixed, 3 Challenges, 5 without enough data.
- Bogle
- Graham
- Buffett & Munger
- Lynch
- Templeton
- Dalio
- Marks
- Druckenmiller
- Swensen
- Wood
- Livermore
- Skeptic
12 seats on WANT, as of Nov 13, 2026: 2 Mixed, 3 Challenges, 5 Not enough data, 2 Does not apply.
Risk Officer
Risk check
What to look at before you hold WANT. Not advice.
As of Nov 14, 2026, WANT crossed 1 of 6 ETFIQ risk lines.
Lines and sources: Method. Check several funds at once on My Portfolio.
More on WANT
Every number below is on this page. Open what you need.Price, 1 year
$42.29−1.2%1 day, priceClose, Nov 13, 2026
Price only. Total return over the same days, distributions reinvested, was −9.0%. Computed by ETFIQ from Tiingo daily prices.
Source: Tiingo end-of-day prices. Data as of Nov 13, 2026. Updated every trading night. Report a data error
| Window | Total return | XLY | +3x the move | Difference | XLY moved about, annualized |
|---|---|---|---|---|---|
| 1M Oct 14 – Nov 13, 2026 | +21.2% | +7.6% | +22.8% | −1.6 pts | 26% |
| 3M Aug 14 – Nov 13, 2026 | −0.5% | +1.7% | +5.1% | −5.6 pts | 20% |
| 6M May 15 – Nov 13, 2026 | −1.7% | +3.4% | +10.2% | −11.9 pts | 21% |
| YTD Dec 31, 2025 – Nov 13, 2026 | −15.0% | +1.1% | +3.3% | −18.3 pts | 20% |
| 1Y Nov 13, 2025 – Nov 13, 2026 | −9.0% | +4.3% | +12.9% | −21.9 pts | 20% |
| 3Y Nov 14, 2023 – Nov 13, 2026 | +52.2% | +46.8% | +140.4% | −88.2 pts | 21% |
| Since launch Nov 29, 2018 – Nov 13, 2026 | +76.9% | +141.2% | not meaningful over this window | not meaningful over this window | 24% |
| Since launch, annualised Nov 29, 2018 – Nov 13, 2026 | +7.4% | – | – | – | – |
Total returns, distributions reinvested. +3x the move is +3 times the window's move. That is not the fund's objective, which is +3 times each day's move.
Source: Tiingo end-of-day prices, with distributions reinvested.
Over the 1 month to Nov 13, 2026, WANT returned +21.2%, where 3 times that move implies +22.8%. The difference is −1.6 pts. Of that, daily compounding is −0.4 pts and the gap to 3 times each day's move compounded is −1.2 pts.
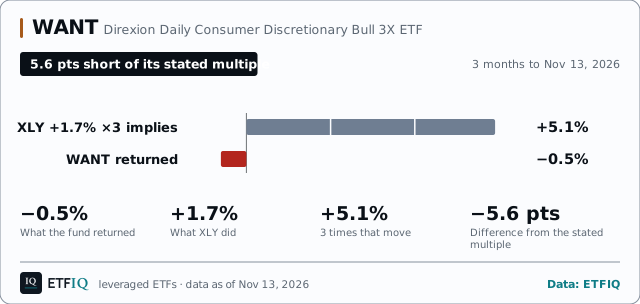
Over the 3 months to Nov 13, 2026, WANT returned −0.5%, where 3 times that move implies +5.1%. The difference is −5.6 pts. Of that, daily compounding is −2.9 pts and the gap to 3 times each day's move compounded is −2.7 pts.
Over the 6 months to Nov 13, 2026, WANT returned −1.7%, where 3 times that move implies +10.2%. The difference is −11.9 pts. Of that, daily compounding is −6.7 pts and the gap to 3 times each day's move compounded is −5.2 pts.
Over the 1 year to Nov 13, 2026, WANT returned −9.0%, where 3 times that move implies +12.9%. The difference is −21.9 pts. Of that, daily compounding is −12.0 pts and the gap to 3 times each day's move compounded is −9.9 pts.
Over the 3 years to Nov 13, 2026, WANT returned +52.2%, where 3 times that move implies +140.4%. The difference is −88.2 pts. Of that, daily compounding is −25.6 pts and the gap to 3 times each day's move compounded is −62.6 pts.
How closely it delivered its daily multiple over 3 months, ranked against 31 leveraged ETFs at 3x, over three months. 100 is best. How it is computed
WANT finished 2.7 points short of what +3 times XLY’s daily move would have given, compounded through the same days.
Money in and out
Daily data · as of Nov 12, 2026WANT: in the 30 trading days to Nov 12, 2026, nothing net moved, from 26 counts.
Nov 12, 2026
Nov 6, 2026 to Nov 12, 2026
Oct 13, 2026 to Nov 12, 2026
21 of 23 trading days counted
Aug 1, 2025 to Jul 31, 2026
monthly, from SEC filings
Aug 1, 2023 to Jul 31, 2026
monthly, from SEC filings
Aug 1, 2021 to Jul 31, 2026
monthly, from SEC filings
monthly, from SEC filings
WANT, net flow each trading day over the 65 sessions from Aug 13, 2026 to Nov 12, 2026: money came in on 0 days and went out on 0 days, of the 26 days with daily data; the other 39 have none. Before Oct 6, 2026 ETFIQ has the fund’s monthly data only, from SEC filings: that span is shaded and draws no bars, and its months are in the month by month list.
No money in or out. 39 days missing.
WANT, net flow each trading day over the 251 sessions from Nov 13, 2025 to Nov 12, 2026: money came in on 0 days and went out on 0 days, of the 26 days with daily data; the other 225 have none. Before Oct 6, 2026 ETFIQ has the fund’s monthly data only, from SEC filings: that span is shaded and draws no bars, and its months are in the month by month list.
No money in or out. 225 days missing.
WANT, net flow each trading day over the 400 sessions from Apr 11, 2025 to Nov 12, 2026: money came in on 0 days and went out on 0 days, of the 26 days with daily data; the other 374 have none. Before Oct 6, 2026 ETFIQ has the fund’s monthly data only, from SEC filings: that span is shaded and draws no bars, and its months are in the month by month list.
No money in or out. 374 days missing.
Daily data starts Oct 6, 2026.
How this is computed
Computed by ETFIQ from Direxion’s daily data: each day’s change in shares outstanding times the previous day’s net asset value. Percentages are of net assets at the start of each window. Numbers are net: money in less money out. Every day and month ETFIQ holds for WANT, back to Aug 2019, is in its flows file. Flows across every fund · How these flows are computed · Compare WANT with other funds in the flows tool
Every trading day, last 3 months26 days
Most recent first.
Week by week, last year6 weeks
Net flow into WANT each week, Oct 6, 2026 to Nov 12, 2026, most recent first, each week named by its last trading day with data. Computed by ETFIQ.
Month by month, money in and money outOct 2023 to Nov 2026
WANT, money in and money out each month from Oct 2023 to Oct 2026: two bars a month, money in above the line and money out below. Bars for Oct 2023 to Jul 2026 are from WANT’s SEC filings (N-PORT item B.6), and for Oct 2026 ETFIQ’s sums of its days. Aug 2026 to Sep 2026 have no data. Nov 2026 is still in progress, so it is in the list and not drawn. Of the 36 months listed, money came in on net in 4 and went out in 13.
Bars for Oct 2023 to Jul 2026 are from WANT’s SEC filings (N-PORT item B.6), and for Oct 2026 ETFIQ’s sums of its days. Of the 36 months listed, money came in on net in 4 and went out in 13.
Most recent first.
How this is computed
N-PORT months: money in is sales plus reinvestments; money out is redemptions. Months summed from daily data: money in adds the days money came in; money out adds the days it went out.
N-PORT months are the filed sales plus reinvestments less redemptions. Later months add up the daily data; the Source column names any missing day.
Source: ETFIQ, from the fund’s daily share counts and net asset values, and its SEC N-PORT filings. Data as of Nov 12, 2026. Last checked Nov 14, 2026.
WANT key stats
Trading
as of Nov 13, 2026
WANT for holders outside the US
Did it keep up with its own daily multiple, compounded day by day, over three months?
That is the share of the 31 leveraged ETFs at 3x, over three months sitting at or below WANT.
Three months only, against the fund's own daily multiple; a different quarter can rank it very differently. Where the fund sits in this set, not a rating. Do not average it with another category's score.
Did it keep up with its own daily multiple, compounded day by day, over three months? 100 is best. Ranked against 31 leveraged ETFs at 3x, over three months.
WANT scores 11.3 on the 3-Month Tracking Score, 28th of 31 leveraged ETFs at 3x, over three months, as of Nov 13, 2026. The set runs from 1.6 to 98.4; each dot is one fund.
WANT: 11.3, 28th of 31.
What moves it. Points against its daily multiple, compounded: −2.70 for WANT, from −3.30 to −1.30 in the set; higher ranks higher.
About WANT
How we measure
Questions people ask about WANT
- Did WANT return +3 times XLY?
- Over the three months to Nov 13, 2026, XLY moved +1.7% and WANT returned −0.5%. 3 times that move is +5.1%, so the fund came out 5.6 points short of it. That is not its objective, which is daily. Against 3 times each day's move, compounded, it was 2.7 points short.
- Why does WANT not return +3 times over a year?
- Because it resets daily. WANT aims at +3 times each day's move, and daily results compound. If the underlying falls and recovers, a holder ends up behind +3 times the period move; in a steady run in one direction, possibly ahead. The longer the holding and the more the underlying swings, the wider the gap.
Links are sources, not endorsements.
Cite this pageCitation, APA and Markdown
ETFIQ, WANT, leveraged ETFs, data as of Nov 13, 2026. https://etfiq.com/funds/want
ETFIQ. (Nov 13, 2026). WANT, leveraged ETFs. Retrieved from https://etfiq.com/funds/want
[WANT, leveraged ETFs (ETFIQ, Nov 13, 2026)](https://etfiq.com/funds/want)
The label bar for WANT, redrawn every trading night.
Free to use with attribution for data ETFIQ computes; issuer data stays under its owner's terms. The underlying files are at Open data.
Embed this chart
Free to use with the credit link. Paste this where the chart should go; it updates every trading night.
<figure style="margin:0;max-width:640px">
<iframe src="https://etfiq.com/embed/leverage/want/" title="WANT: WANT returned −0.5% while 3 times XLY's move would have been +5.1%. Data from Aug 14, 2026 to Nov 13, 2026." width="640" height="334" loading="lazy" style="border:0;max-width:100%;width:100%"></iframe>
<figcaption style="font:13px/1.5 sans-serif">WANT: WANT returned −0.5% while 3 times XLY's move would have been +5.1%. Data from Aug 14, 2026 to Nov 13, 2026. Data: <a href="https://etfiq.com/funds/want">ETFIQ</a></figcaption>
</figure>The day's ETF flows, a comparison and one number. Every trading morning. About the Daily
Snapshot, Nov 13, 2026. More on the tabs above.