
PJUL Innovator U.S. Equity Power Buffer ETF - Jul

Share ▾
Share on XDownload as PDF
$49.98
+1.0% · 1 day, price
IQ’s readingComputed nightly from ETFIQ data. Not written live.

Since Jun 30, 2026, PJUL returned 2.5%, against SPY's 2.6% price return. It can gain 10.9% more before its cap.

Absorbs the first 15% of loss on SPY and caps the gain at 14.0%, over a period ending Jun 30, 2027Innovator ↗Expense ratio 0.79%Fund assets $1.3bn on Nov 4, 2026Benchmark SPYFund page at the issuer ↗SEC filings ↗Every Innovator fund ETFIQ covers

Promise check: Not measuredNo outcome period of its has finished in ETFIQ's record (snapshots from Sep 4, 2026).

PJUL risk and return scorecard

vs SPY · Aug 2018 to Oct 2026 · 428 weekly returns · dividend-adjusted

8.2 years
PJUL +97.7%, SPY +200.4%, Aug 2018 to Oct 2026, distributions reinvested.
Return
MeasurePJULSPYEdge
Total return+97.7%+200.4%SPY
Annualized+8.6%+14.3%SPY
Price return+96.1%+165.1%SPY
Risk
MeasurePJULSPYEdge
Volatility8.9%18.2%PJUL
Max drawdown−16.4%−31.8%PJUL
Upside capture35.8%100.0%SPY
Downside capture53.9%100.0%PJUL
Risk-adjusted
MeasurePJULSPYEdge
Sharpe ratio0.660.67Tie
Sortino ratio0.950.97Tie
Alpha vs SPY
MeasurePJULSPYEdge
Alpha, a year+0.2%Not significant
Alpha t-stat0.21
Beta to SPY0.461.00Lower beta

Computed by ETFIQ from Tiingo daily prices and ETFIQ's distribution records; risk-free rate: U.S. Treasury, Daily Treasury Bill Rates, 13-week coupon equivalent Method · Data

Money in and out

Net fund flows · Nov 3, 2026
Latest day
$0
Last 5 trading days
$0
12 months to Jul 31, 2026
−$48.9m
In on 0 days, out on 2. 48 days missing.

What you earned

PJUL −0.2%, SPY price return −1.0%: total return over one month to Nov 4, 2026.
PJUL−0.2%
SPY−1.0%
PJUL +0.6%, SPY price return −0.4%: total return over three months to Nov 4, 2026.
PJUL+0.6%
SPY−0.4%
PJUL +3.9%, SPY price return +4.5%: total return over six months to Nov 4, 2026.
PJUL+3.9%
SPY+4.5%
PJUL +7.7%, SPY price return +12.4%: total return over the year to Nov 4, 2026.
PJUL+7.7%
SPY+12.4%
PJUL +9.3%, SPY price return +13.6%: total return over one year to Nov 4, 2026.
PJUL+9.3%
SPY+13.6%
PJUL +46.5%, SPY price return +76.4%: total return over three years to Nov 4, 2026.
PJUL+46.5%
SPY+76.4%
PJUL +63.3%, SPY price return +63.7%: total return over five years to Nov 4, 2026.
PJUL+63.3%
SPY+63.7%
PJUL +100.8%, SPY price return +168.6%: total return since launch to Nov 4, 2026.
PJUL+100.8%
SPY+168.6%

Where does it stand in this outcome period?

Outcome period Jun 30, 2026 to Jun 30, 2027
10.9%
Can still gain from today’s fund price
2.7%
Fall before the buffer from today’s fund price
15.0%
Protection left, index points
238
Days to reset

More on PJUL

Every number below is on this page. Open what you need.

PJUL flows, by email on Sundays.

One-click unsubscribe. See Privacy.

Price, 1 year

$49.98+1.0%1 day, priceClose, Nov 4, 2026

Price only. No distribution was paid over these days, so total return is the same. Computed by ETFIQ from Tiingo daily prices.

Source: Tiingo end-of-day prices. Data as of Nov 4, 2026. Updated every trading night. Report a data error

Points (pts) are percentage points.

PJUL returns by window: total return, cash paid and price change
WindowTotal returnSPY price returnGap to SPY
1M Oct 5 – Nov 4, 2026−0.2%−1.0%+0.8 pts
3M Aug 5 – Nov 4, 2026+0.6%−0.4%+1.0 pts
6M May 6 – Nov 4, 2026+3.9%+4.5%−0.6 pts
YTD Dec 31, 2025 – Nov 4, 2026+7.7%+12.4%−4.7 pts
1Y Nov 4, 2025 – Nov 4, 2026+9.3%+13.6%−4.3 pts
3Y Nov 3, 2023 – Nov 4, 2026+46.5%+76.4%−29.9 pts
5Y Nov 5, 2021 – Nov 4, 2026+63.3%+63.7%−0.4 pts
Since launch Aug 8, 2018 – Nov 4, 2026+100.8%+168.6%−67.8 pts
Since launch, annualised Aug 8, 2018 – Nov 4, 2026+8.8%––

Total returns, distributions reinvested. SPY's column is its price return, dividends left out: the basis the outcome period uses.

Source: Tiingo end-of-day prices, with distributions reinvested.

Email me when PJUL's outcome period resets.

Confirm by email. One a day at most, and one click stops it. See Privacy.

Between buffer and cap
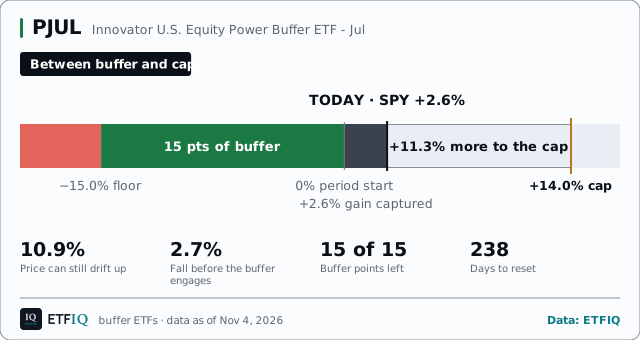
Between buffer and capPJUL: reference +2.6% since period start, fund +2.5%; buffer 0 to −15; cap +14.0%; Between buffer and cap. Data to Nov 4, 2026.15 pts of buffer+2.6%+11.3% more to the cap−15.0% floor0% period start+14.0% capTODAY · SPY +2.6%Between buffer and capPJUL: reference +2.6% since period start, fund +2.5%; buffer 0 to −15; cap +14.0%; Between buffer and cap. Data to Nov 4, 2026.15 pts−15.0% floor0% start+14.0% cap+2.6% gain captured+11.3% more to the capTODAY · SPY +2.6%

PJUL: reference +2.6% since period start, fund +2.5%; buffer 0 to −15; cap +14.0%; Between buffer and cap. Data to Nov 4, 2026.

83.2
IQ Buffer ScoreETFIQ Downside Cover Scorejoint 27th of 292 · Nov 4, 2026
0.3 · lowest of 292 buffer ETFs on stocks with a live outcome period99.7 · highest

How much of a bear-market fall the buffer would absorb from today's level, ranked against 292 buffer ETFs on stocks with a live outcome period. 100 is best. How it is computed

PJUL absorbs 75% of the next 20% fall in what it tracks. It has 11.1% of upside left in index terms, 79% of the cap it started with.

share of a 20% fall the buffer absorbs75.0% · 83rd pct

Money in and out

Daily data · as of Nov 3, 2026

PJUL: in the 18 trading days to Nov 3, 2026, net $3.7m went out, over 17 of 18 trading days.

1D
$0
0.0% of $1.3bn on Nov 2, 2026
Nov 3, 2026
6D
$0
Oct 27, 2026 to Nov 3, 2026
12 months
−$48.9m
−4.1% of $1.2bn on Jul 31, 2025
Aug 1, 2025 to Jul 31, 2026
monthly, from SEC filings
3 years
−$80.6m
−8.1% of $996m on Jul 31, 2023
Aug 1, 2023 to Jul 31, 2026
monthly, from SEC filings
5 years
+$572m
223.2% of $256m on Jul 31, 2021
Aug 1, 2021 to Jul 31, 2026
monthly, from SEC filings
Feb 2020 to Jul 2026
+$723m
Feb 1, 2020 to Jul 31, 2026
monthly, from SEC filings
Net flow each trading day
Net flow into PJUL each trading day, Aug 4, 2026 to Nov 3, 2026−$1.2m−$2.5mmonthly, from SEC filingsdaily, from Innovator+$2.5m−$2.5mAug 4, 2026Nov 3, 2026

PJUL, net flow each trading day over the 65 sessions from Aug 4, 2026 to Nov 3, 2026: money came in on 0 days and went out on 2 days, of the 17 days with daily data; the other 48 have none. Before Oct 6, 2026 ETFIQ has the fund’s monthly data only, from SEC filings: that span is shaded and draws no bars, and its months are in the month by month list.

In on 0 days, out on 2. 48 days missing.

Net flow into PJUL each trading day, Nov 4, 2025 to Nov 3, 2026−$1.2m−$2.5mmonthly, from SEC filingsdaily, from Innovator+$2.5m−$2.5mNov 4, 2025Nov 3, 2026

PJUL, net flow each trading day over the 251 sessions from Nov 4, 2025 to Nov 3, 2026: money came in on 0 days and went out on 2 days, of the 17 days with daily data; the other 234 have none. Before Oct 6, 2026 ETFIQ has the fund’s monthly data only, from SEC filings: that span is shaded and draws no bars, and its months are in the month by month list.

In on 0 days, out on 2. 234 days missing.

Net flow into PJUL each trading day, Apr 2, 2025 to Nov 3, 2026−$1.2m−$2.5mmonthly, from SEC filingsdaily, from Innovator+$2.5m−$2.5mApr 2, 2025Nov 3, 2026

PJUL, net flow each trading day over the 400 sessions from Apr 2, 2025 to Nov 3, 2026: money came in on 0 days and went out on 2 days, of the 17 days with daily data; the other 383 have none. Before Oct 6, 2026 ETFIQ has the fund’s monthly data only, from SEC filings: that span is shaded and draws no bars, and its months are in the month by month list.

In on 0 days, out on 2. 383 days missing.

Money in, netMoney out, netMonthly basis

Daily data starts Oct 9, 2026.

How this is computed

Computed by ETFIQ from Innovator’s daily data: each day’s change in shares outstanding times the previous day’s net asset value. Percentages are of net assets at the start of each window. Numbers are net: money in less money out. Every day and month ETFIQ holds for PJUL, back to Feb 2020, is in its flows file. Flows across every fund · How these flows are computed · Compare PJUL with other funds in the flows tool

Every trading day, last 3 months17 days
Nov 3, 2026 $0
Nov 2, 2026 $0
Oct 30, 2026 $0
Oct 29, 2026 $0
Oct 28, 2026 $0 covers 2 trading days
Oct 26, 2026 −$2.5m
Oct 23, 2026 $0
Oct 22, 2026 $0
Oct 21, 2026 $0
Oct 20, 2026 $0
Oct 19, 2026 −$1.2m
Oct 16, 2026 $0
Oct 15, 2026 $0
Oct 14, 2026 $0
Oct 13, 2026 $0
Oct 12, 2026 $0
Oct 9, 2026 $0

Most recent first.

Week by week, last year5 weeks
Nov 3, 2026 $0 2 days
Oct 30, 2026 −$2.5m 4 of 5 trading days
Oct 23, 2026 −$1.2m
Oct 16, 2026 $0
Oct 9, 2026 $0 1 day

Net flow into PJUL each week, Oct 9, 2026 to Nov 3, 2026, most recent first, each week named by its last trading day with data. Computed by ETFIQ.

Month by month, money in and money outOct 2023 to Nov 2026

PJUL, money in and money out each month from Oct 2023 to Oct 2026: two bars a month, money in above the line and money out below. Bars for Oct 2023 to Jul 2026 are from PJUL’s SEC filings (N-PORT item B.6), and for Oct 2026 ETFIQ’s sums of its days. Aug 2026 to Sep 2026 have no data. Nov 2026 is still in progress, so it is in the list and not drawn. Of the 36 months listed, money came in on net in 8 and went out in 27.

Bars for Oct 2023 to Jul 2026 are from PJUL’s SEC filings (N-PORT item B.6), and for Oct 2026 ETFIQ’s sums of its days. Of the 36 months listed, money came in on net in 8 and went out in 27.

MonthInOutNet
Nov 2026 ETFIQ, the sum of its days, Nov 2 to Nov 3$0$0$0
Oct 2026 ETFIQ, the sum of its days, Oct 9 to Oct 30, 15 of 16 trading days$0−$3.7m−$3.7m
Jul 2026 SEC Form N-PORT+$248m$0+$248m
Jun 2026 SEC Form N-PORT+$1.2m−$7.3m−$6.1m
May 2026 SEC Form N-PORT$0−$14.5m−$14.5m
Apr 2026 SEC Form N-PORT$0−$9.4m−$9.4m
Mar 2026 SEC Form N-PORT$0−$13.9m−$13.9m
Feb 2026 SEC Form N-PORT$0−$10.5m−$10.5m
Jan 2026 SEC Form N-PORT$0−$75.9m−$75.9m
Dec 2025 SEC Form N-PORT+$2.3m−$52.0m−$49.6m
Nov 2025 SEC Form N-PORT$0−$77.8m−$77.8m
Oct 2025 SEC Form N-PORT+$1.1m−$27.4m−$26.3m
Sep 2025 SEC Form N-PORT+$62.3m−$22.6m+$39.7m
Aug 2025 SEC Form N-PORT+$6.7m−$58.8m−$52.1m
Jul 2025 SEC Form N-PORT+$270m$0+$270m
Jun 2025 SEC Form N-PORT+$9.6m−$19.2m−$9.5m
May 2025 SEC Form N-PORT$0−$11.4m−$11.4m
Apr 2025 SEC Form N-PORT+$20.1m−$15.2m+$4.9m
Mar 2025 SEC Form N-PORT+$3.1m−$13.2m−$10.1m
Feb 2025 SEC Form N-PORT$0−$24.1m−$24.1m
Jan 2025 SEC Form N-PORT+$1.0m−$27.0m−$26.0m
Dec 2024 SEC Form N-PORT+$7.3m−$45.5m−$38.3m
Nov 2024 SEC Form N-PORT$0−$28.6m−$28.6m
Oct 2024 SEC Form N-PORT$0−$41.4m−$41.4m
Sep 2024 SEC Form N-PORT$0−$20.0m−$20.0m
Aug 2024 SEC Form N-PORT+$26.3m−$6.8m+$19.5m
Jul 2024 SEC Form N-PORT+$270m−$2.0m+$268m
Jun 2024 SEC Form N-PORT+$545m−$568m−$23.3m
May 2024 SEC Form N-PORT$0−$42.3m−$42.3m
Apr 2024 SEC Form N-PORT$0−$65.4m−$65.4m
Mar 2024 SEC Form N-PORT$0−$55.6m−$55.6m
Feb 2024 SEC Form N-PORT$0−$122m−$122m
Jan 2024 SEC Form N-PORT$0−$102m−$102m
Dec 2023 SEC Form N-PORT$0−$39.6m−$39.6m
Nov 2023 SEC Form N-PORT+$32.7m−$15.7m+$17.0m
Oct 2023 SEC Form N-PORT+$6.0m−$3.3m+$2.6m

Most recent first.

How this is computed

N-PORT months: money in is sales plus reinvestments; money out is redemptions. Months summed from daily data: money in adds the days money came in; money out adds the days it went out.

N-PORT months are the filed sales plus reinvestments less redemptions. Later months add up the daily data; the Source column names any missing day.

Source: ETFIQ, from the fund’s daily share counts and net asset values, and its SEC N-PORT filings. Data as of Nov 3, 2026. Last checked Nov 5, 2026.

PJUL key stats

52-week high, daily closes to Nov 4, 2026 (ETFIQ)$50.32 on Oct 9, 2026
52-week low, daily closes to Nov 4, 2026 (ETFIQ)$45.20 on Nov 20, 2025
Close on Nov 4, 2026, within that range (ETFIQ)$49.99, 93% of the way from the low to the high
Range, beta and R-squared computed by ETFIQ from Tiingo daily prices.

Trading

as of Nov 4, 2026
Trading · PJULas of Nov 4, 2026
79
Liquid59th percentile of 283 buffer ETFs4 of 6 measured · Nov 4, 2026
0 · Hard to tradeIQ Liquidity Score100 · Trades like a giant

Liquid: trades at a typical spread of 0.20%, and its holdings can absorb $15bn a day.

Cost for your order · one way, half its 30-day median spread
$1,000$1.000.10%
$10,000$100.10%
$100,000 · estimate$1010.10%
Full cost to own · 1 year at $10,000
1.06%fee alone 0.79%
Fee + round-trip spread + median premium paid
Premium or discount to NAV, Nov 4 close−0.06%
−0.2%95% of days within ±0.10% · the 1% band is off this scale+0.2%
How to tradeLimit: midpoint + 5¢ to buy, midpoint − 5¢ to sell.At the Nov 4 close of $49.99, that’s $50.04 to buy and $49.94 to sell.
Full trading page: components, premium history, dealers →

PJUL for holders outside the US

US tax withheld on dividends, no treaty30%
Treaty rates on dividends (IRS table, read Oct 30, 2026)65 countries, 10% to 30%
PJUL interest-related and short-term gain dividendsnot read by ETFIQ
US estate tax filing threshold, non-resident holders$60,000
Share classDistributing

PJUL is a US fund. Stock of US corporations counts as US property for a non-resident's estate. Facts from the IRS, not tax advice. How withholding and treaties work

If the market falls into a bear market from here, how much does the buffer absorb?

Share of a 20% fall the buffer absorbs
QBQV 0.0%TJUN 0.0%TSEP 9.6%EMJN 10.9%EBUF 11.3%QJN 11.3%QJUN 17.1%QBUF 17.4%DNOV 21.9%QJL 22.5%PQV 25.0%, and 2 more at this point: EJUL 25.4%, SNOV 25.6%QBIV 25.0%QBKV 25.0%QBSV 25.0%PQOC 27.7%UDEC 29.3%QSPT 29.5%PQJL 29.8%DDEC 31.4%DMAR 32.6%FNOV 33.5%EMJL 34.5%UAPR 35.3%UJAN 35.3%EOCT 36.3%QMNV 36.3%QQJN 36.3%DJAN 37.4%FHDG 37.5%KDEC 39.1%DFEB 39.3%QAU 39.4%ARLU 39.7%, and 1 more at this point: QMAR 39.7%UMAR 40.0%UFEB 40.1%RSMR 41.4%RSDE 41.8%EMMY 42.1%NOCT 42.4%SCJL 42.4%QBQF 42.7%BAPR 42.8%, and 1 more at this point: KJAN 42.8%GNOV 43.3%NJUN 43.4%FMAR 43.5%PQAP 43.9%APRT 44.1%TDEC 44.4%NJUL 44.5%BSEP 44.6%STEN 44.8%, and 10 more at this point: BAUG 45.0%, BDEC 45.0%, BFEB 45.0%, BJAN 45.0%, BJUL 45.0%, BJUN 45.0%, BMAR 45.0%, BMAY 45.0%, BNOV 45.0%, BOCT 45.0%DECT 45.1%SEPZ 45.2%TENM 45.4%DECZ 46.6%DECP 47.2%JUNC 47.2%APRP 47.3%, and 8 more at this point: SCAU 47.3%, QDEC 47.4%, OCTZ 47.5%, QQJL 47.5%, TEND 47.5%, TENJ 47.5%, APRZ 47.8%, AUGC 47.8%KJUL 47.3%FDEC 48.1%JANT 48.1%DAPR 48.2%KAPR 48.4%, and 1 more at this point: SAUG 48.4%IDEC 49.0%NAPR 49.5%PDEC 49.5%SEPT 49.8%, and 42 more at this point: AUGT 50.0%, AUGZ 50.0%, EALT 50.0%, EMAU 50.0%, FAPR 50.0%, FAUG 50.0%, FEBT 50.0%, FEBZ 50.0%, FFEB 50.0%, FJAN 50.0%, FJUL 50.0%, FJUN 50.0%, FMAY 50.0%, FOCT 50.0%, FSEP 50.0%, IBUF 50.0%, JANZ 50.0%, JULC 50.0%, JULT 50.0%, JULZ 50.0%, JUNT 50.0%, JUNZ 50.0%, MART 50.0%, MARZ 50.0%, MAYC 50.0%, MAYT 50.0%, MAYZ 50.0%, NOVZ 50.0%, NVBT 50.0%, OCTT 50.0%, PQX 50.0%, QMY 50.0%, RBUF 50.0%, RSJN 50.0%, RSSE 50.0%, SIXD 50.0%, SIXF 50.0%, SIXJ 50.0%, SIXO 50.0%, SIXZ 50.0%, TMAR 50.0%, ZALT 50.0%SIXP 49.8%NDEC 50.2%PQJA 50.5%UMAY 51.8%GMAR 52.0%JANP 52.1%DECW 53.9%GDEC 53.9%NJAN 54.1%, and 1 more at this point: QQBF 54.5%YMAR 54.1%PAPR 55.0%PBDE 55.0%NMAR 55.5%PJAN 55.5%QMFE 55.8%DMAY 56.4%YDEC 56.4%MRCP 56.8%FEBP 57.0%NSEP 57.4%KSEP 57.8%JANU 58.0%NFEB 58.5%EJAN 58.7%MARU 58.9%PBAP 59.0%, and 2 more at this point: IJAN 59.1%, SCJN 59.1%KFEB 59.4%GJAN 59.5%QMAG 59.9%, and 7 more at this point: AUGP 60.0%, DJUL 60.0%, JULP 60.0%, JUNP 60.0%, MAYP 60.0%, NOVP 60.0%, OCTP 60.0%SEPP 59.9%APRW 60.2%DECU 60.3%, and 2 more at this point: DJUN 60.5%, JANW 60.5%PFEB 60.6%PMAR 60.8%PBJA 61.0%IDAU 61.1%GFEB 61.6%QCJA 62.1%KAUG 62.3%DHDG 62.5%, and 1 more at this point: SQMX 62.5%KMAR 62.5%EAPR 63.0%, and 1 more at this point: QMMY 63.0%FEBU 63.0%UJUL 63.3%KJUN 63.6%IAPR 64.0%FEBW 64.2%QQAU 64.4%UAUG 64.5%PBFB 64.7%MARW 65.0%, and 1 more at this point: SFEB 65.0%UJUN 65.2%PBMR 65.5%ISEP 67.0%DSEP 67.4%NOVM 67.5%DAUG 68.4%IDJN 68.5%DOCT 69.1%SCMY 70.0%GAPR 70.3%DECM 70.8%UNOV 71.5%UOCT 71.5%USEP 71.9%CJUN 72.2%ARLI 72.7%CAUG 72.8%JANM 74.0%PMAY 74.4%PSEP 74.6%QCAP 74.7%SEPU 74.8%, and 45 more at this point: AUGU 75.0%, CJUL 75.0%, CMAY 75.0%, GAUG 75.0%, GJUL 75.0%, GJUN 75.0%, GMAY 75.0%, GOCT 75.0%, IAUG 75.0%, IDJL 75.0%, IDMY 75.0%, IFEB 75.0%, IJUL 75.0%, IJUN 75.0%, IMAR 75.0%, IMAY 75.0%, INOV 75.0%, IOCT 75.0%, JANI 75.0%, JNEU 75.0%, JULI 75.0%, JULU 75.0%, KMAY 75.0%, KNOV 75.0%, KOCT 75.0%, MAYU 75.0%, NAUG 75.0%, NMAY 75.0%, NNOV 75.0%, NVBU 75.0%, OCTI 75.0%, OCTU 75.0%, PAUG 75.0%, PJUN 75.0%, PNOV 75.0%, POCT 75.0%, PQXV 75.0%, QBIF 75.0%, QBKF 75.0%, QBSF 75.0%, QQMY 75.0%, SMAY 75.0%, SQBA 75.0%, YJUN 75.0%, YSEP 75.0%GSEP 75.1%, and 1 more at this point: MAYW 75.2%MARM 75.7%PBMY 76.0%FEBM 76.3%CTMA 79.7%APXM 81.5%JULW 84.6%PBJL 85.7%JUNW 86.3%AUGW 86.4%PBAU 87.3%QCOC 87.3%PBJN 87.5%QCJL 89.1%NVBW 92.9%OCTW 93.0%SEPW 93.2%PBNV 94.0%PBOC 94.1%PBSE 94.1%CTJL 94.3%PQXX 96.9%BALT 97.0%CTAU 100.0%CTJN 100.0%PJUL 75.0%PJUL 75.0%0.0%100.0%
0.0% to 100.0% across 292

That is the share of the 292 buffer ETFs on stocks with a live outcome period sitting at or below PJUL.

Today's position against one 20% fall; it ignores smaller falls, and stock buffers are never ranked against bond or commodity ones. Where the fund sits in this set, not a rating. Do not average it with another category's score.

About PJUL

Reference indexSPY
Buffer15%
Outcome periodJun 30, 2026 to Jun 30, 2027
Starting cap+14.0%
SPY return since period start+2.6%
Fund return since period start+2.5%
Net assets (issuer page, as of Nov 4, 2026)$1.3bnReport
Band state today (ETFIQ)Open
Can still gain (issuer, fund price)10.9%
Fall before buffer (issuer, fund price)2.7%
Fall to the buffer in index terms (ETFIQ)2.6%
Protection left in index points (ETFIQ)15.0% of 15.0%
Days left in period238
Expense ratio (issuer page, Nov 4, 2026)0.79%Report
How we measure
Issuer-published data as of the date shown; ETFIQ calculations marked. Definitions on the learn page. Method
IQ Investment Committee on PJUL

12 seats on PJUL, as of Nov 4, 2026: 1 Supports, 2 Challenges, 7 Not enough data, 2 Does not apply.

In the tradition ofJohn BogleBogle-style Low CostChallenges
In the tradition ofBenjamin GrahamGraham-style Margin of SafetyNot enough data
In the tradition ofWarren Buffett & Charlie MungerBuffett & Munger-style QualityNot enough data
In the tradition ofPeter LynchLynch-style Growth at a Reasonable PriceNot enough data
In the tradition ofJohn TempletonTempleton-style Global ContrarianDoes not apply
In the tradition ofRay DalioDalio-style All-WeatherNot enough data
In the tradition ofHoward MarksMarks-style Cycles & RiskNot enough data
In the tradition ofStanley DruckenmillerDruckenmiller-style Macro & LiquidityDoes not apply
In the tradition ofDavid SwensenSwensen-style DiversificationChallenges
In the tradition ofCathie WoodWood-style Disruptive InnovationNot enough data
In the tradition ofJesse LivermoreLivermore-style Trend FollowingSupports
Uses ETFIQ’s measuresThe ETFIQ SkepticETFIQ’s own seatNot enough data
Put PJUL to the committee →See all seats →No investor named is affiliated with or endorses ETFIQ. Not investment advice.

Questions people ask about PJUL

How much can PJUL still gain?
About 10.9% from its price on Nov 4, 2026, before it reaches its cap, by the issuer's published number. The cap for the period was set at +14.0%.
How far can PJUL fall before the buffer helps?
2.7% in fund-price terms on Nov 4, 2026, by the issuer's number. In index terms SPY can fall 2.6% from that level before the buffer begins. Losses until that point are the holder's.
How much of the PJUL buffer is left?
15.0% of the 15.0% buffer sat below the SPY level on Nov 4, 2026. That is an ETFIQ calculation in index points, on one definition for every issuer.
When does PJUL reset?
The outcome period ends on Jun 30, 2027, 238 days from the data on Nov 4, 2026. A new cap is set the next day and the buffer starts again.
What does PJUL cost?
The prospectus expense ratio is 0.79% a year.
Sources and dates
Prices, PJUL and SPY price returnTiingo end-of-day · Nov 4, 2026
Fee, 0.79%Issuer page · Nov 4, 2026
Net assets, $1.3bnIssuer page · Nov 4, 2026

Links are sources, not endorsements.

Cite this pageCitation, APA and Markdown

ETFIQ, PJUL, buffer ETFs, data as of Nov 4, 2026. https://etfiq.com/funds/pjul

The outcome band for PJUL, redrawn every trading night.

Free to use with attribution for data ETFIQ computes; issuer data stays under its owner's terms. The underlying files are at Open data.

Buffer
The first slice of loss the fund absorbs for you over its outcome period, stated on the reference index. A 15% buffer means the index can fall 15% before you take any of it.
The most the fund can return over the period if held from the first day to the last. Quoted gross and net of fees. Set by the option market on day one, so the same fund can have a different cap each year.
The window, usually twelve months and sometimes six or three, over which the buffer and, where there is one, the cap apply. On its last day the options expire, the fund resets, and fresh terms are struck from that day’s option prices.
Reset
The day one outcome period ends and the next begins, with a fresh buffer and fresh terms struck at that day’s level.
How much of the buffer still sits below today’s index level. All of it when the index is above its starting level; less once the index is inside the buffer range.
Embed this chart

Free to use with the credit link. Paste this where the chart should go; it updates every trading night.
PJUL: PJUL: reference +2.6% since period start, fund +2.5%; buffer 0 to −15; cap +14.0%; Between buffer and cap. Data to Nov 4, 2026.
<figure style="margin:0;max-width:640px">
<iframe src="https://etfiq.com/embed/buffer/pjul/" title="PJUL: PJUL: reference +2.6% since period start, fund +2.5%; buffer 0 to −15; cap +14.0%; Between buffer and cap. Data to Nov 4, 2026." width="640" height="370" loading="lazy" style="border:0;max-width:100%;width:100%"></iframe>
<figcaption style="font:13px/1.5 sans-serif">PJUL: PJUL: reference +2.6% since period start, fund +2.5%; buffer 0 to −15; cap +14.0%; Between buffer and cap. Data to Nov 4, 2026. Data: <a href="https://etfiq.com/funds/pjul">ETFIQ</a></figcaption>
</figure>

How to embed ETFIQ charts

Get the ETFIQ Daily

The day's ETF flows, a comparison and one number. Every trading morning. About the Daily

The ETFIQ Daily and our other emails. Unsubscribe from any one in a click. See Privacy.

Snapshot, Nov 4, 2026. More on the tabs above.