


PRAB · State Street IG Public & Private ABS ETF
PRAB returned +1.6% from Mar 11, 2026 to Oct 20, 2026, charges 0.39% a year and holds $27m in net assets on Oct 20, 2026.
PRAB is actively managed and returned +1.6% since it first traded on Mar 11, 2026.
Price and total return since launch, Mar 11, 2026
$24.770.0%1 day, priceClose, Oct 20, 2026
Total return adds every distribution, reinvested. Computed by ETFIQ from Tiingo daily prices.
Source: Tiingo end-of-day prices. Data as of Oct 20, 2026. Updated every trading night. Report a data error
| Window | Total return |
|---|---|
| 1M Sep 18 – Oct 20, 2026 | +0.2% |
| 3M Jul 21 – Oct 20, 2026 | +0.6% |
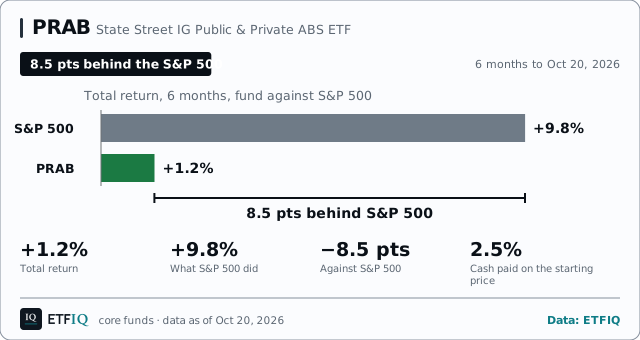
| 6M Apr 21 – Oct 20, 2026 | +1.2% |
| Since launch Mar 11 – Oct 20, 2026 | +1.6% |
Total return at closing prices, distributions reinvested. Every column is a total return. Not shown: year to date, 1 year and 3 years, which the fund has not been listed long enough to fill (listed Mar 2026); its since-launch row covers all of its record. Source: ETFIQ.
Source: Tiingo end-of-day prices, with distributions reinvested. Data as of Oct 20, 2026. Updated every trading night. Report a data error
Money in and out
Daily figures · as of Oct 20, 2026PRAB: in the 155 trading days to Oct 20, 2026, net $2.5m came in.
Oct 20, 2026
Oct 14, 2026 to Oct 20, 2026
Sep 21, 2026 to Oct 20, 2026
Jul 21, 2026 to Oct 20, 2026
SEC filings, then daily counts
PRAB, net flow each trading day over the 63 sessions from Jul 23, 2026 to Oct 20, 2026: money came in on 1 day and went out on 0 days.
Money in on 1 of the 63 trading days, out on 0.
PRAB, net flow each trading day over the 252 sessions from Oct 20, 2025 to Oct 20, 2026: money came in on 1 day and went out on 0 days, of the 155 days with a daily figure; the other 97 have none. Before Mar 11, 2026 ETFIQ has the fund’s monthly figures only, from SEC filings: that span is shaded and draws no bars, and its months are in the month by month list.
Money in on 1 day, out on 0. Daily figures for 155 of 252 trading days; none for 97.
PRAB, net flow each trading day over the 400 sessions from Mar 19, 2025 to Oct 20, 2026: money came in on 1 day and went out on 0 days, of the 155 days with a daily figure; the other 245 have none. Before Mar 11, 2026 ETFIQ has the fund’s monthly figures only, from SEC filings: that span is shaded and draws no bars, and its months are in the month by month list.
Money in on 1 day, out on 0. Daily figures for 155 of 400 trading days; none for 245.
ETFIQ’s daily counts for PRAB start Mar 11, 2026, so the year to date and 1 year windows have no daily figure.
How this is computed
Computed by ETFIQ from State Street’s daily figures: each day’s change in shares outstanding times the previous day’s net asset value. Percentages are of net assets at the start of each window. Figures are net: money in less money out. Checked against the filing: The month’s daily sum and the filing’s B.6 figure agree within rounding or, where the filing’s is larger, within rounding plus the fund’s creation and redemption fees. The full rule is in the fund’s flows file. Every day and month ETFIQ holds for PRAB, back to Mar 2026, is in its flows file. Flows across every fund · How these flows are computed · Compare PRAB with other funds in the flows tool
Every trading day, last 3 months65 days
Most recent first.
Week by week, last year33 weeks
Net flow into PRAB each week, Mar 11, 2026 to Oct 20, 2026, most recent first, each week named by its last trading day with a figure. Computed by ETFIQ.
Month by month, money in and money outMar 2026 to Oct 2026
PRAB, money in and money out each month from Mar 2026 to Sep 2026: two bars a month, money in above the line and money out below. Bars for Mar 2026 to Jul 2026 are from PRAB’s SEC filings (N-PORT item B.6), and for Aug 2026 to Sep 2026 ETFIQ’s sums of its days. Oct 2026 is still in progress, so it is in the list and not drawn. Of the 8 months listed, money came in on net in 2 and went out in 0.
Bars for Mar 2026 to Jul 2026 are from PRAB’s SEC filings (N-PORT item B.6), and for Aug 2026 to Sep 2026 ETFIQ’s sums of its days. Of the 8 months listed, money came in on net in 2 and went out in 0.
Most recent first.
How this is computed
N-PORT months: money in is sales plus reinvestments; money out is redemptions. Months summed from daily figures: money in adds the days money came in; money out adds the days it went out.
N-PORT months are the filed sales plus reinvestments less redemptions. Later months add up the daily figures; the Source column names any missing day.
Source: ETFIQ, from the fund’s daily share counts and net asset values, and its SEC N-PORT filings. Data as of Oct 20, 2026. Updated every trading night. Report a data error
PRAB key stats
About PRAB
Questions people ask about PRAB
- What does PRAB cost?
- The prospectus expense ratio is 0.39% a year.
- How far is PRAB below its high?
- 0.0% below its high of Oct 19, 2026, measured on the reinvested series to Oct 20, 2026.
ETFIQ links to the documents behind every figure; a link is not an endorsement.
Cite this pageCitation, APA and Markdown
ETFIQ, PRAB, bond fund, data as of Oct 20, 2026. https://etfiq.com/funds/prab
ETFIQ. (Oct 20, 2026). PRAB, bond fund. Retrieved from https://etfiq.com/funds/prab
[PRAB, bond fund (ETFIQ, Oct 20, 2026)](https://etfiq.com/funds/prab)
Free to use with attribution for figures ETFIQ computes; issuer data stays under its owner's terms. The underlying files are at Open data.
Embed this chart
Free to use with the credit link. Paste this where the chart should go; it updates every trading night.
<figure style="margin:0;max-width:640px">
<a href="https://etfiq.com/funds/prab"><img src="https://etfiq.com/assistant/api/embed/core/prab.svg" alt="PRAB: PRAB over 6 months: total return +1.2%, S&P 500 +9.8%, −8.5 pts. Figures to Oct 20, 2026." width="640" style="max-width:100%;height:auto"></a>
<figcaption style="font:13px/1.5 sans-serif">PRAB: PRAB over 6 months: total return +1.2%, S&P 500 +9.8%, −8.5 pts. Figures to Oct 20, 2026. Data: <a href="https://etfiq.com/funds/prab">ETFIQ</a></figcaption>
</figure>Four ranked ETF lists in one email every Friday morning. The last note