

XOP · State Street SPDR S&P Oil & Gas Exploration & Production ETF
Share ▾
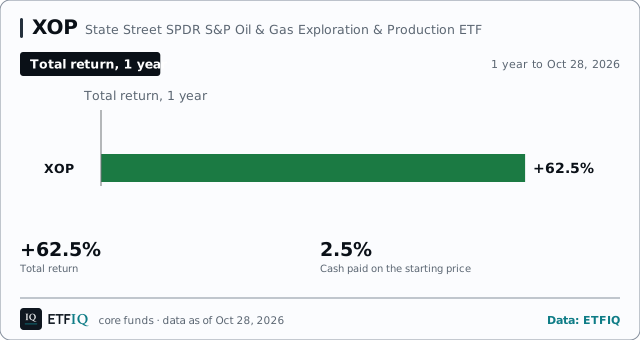
XOP tracks the S&P Oil & Gas Exploration & Production and returned +62.5% over the past year.
XOP has 52 holdings by its book of Oct 27, 2026 and returned +62.5% over the year to Oct 28, 2026.
Promise check: Not measuredNo other ETF tracks the index it names, so its tracking cannot be measured.
XOP risk and return scorecard
vs its own holdings
Computed by ETFIQ from Tiingo daily prices and ETFIQ's distribution records; risk-free rate: U.S. Treasury, Daily Treasury Bill Rates, 13-week coupon equivalent Method · Data
Money in and out
Net fund flows · Oct 22, 2026What you earned
How concentrated, and what does it cost?
S&P Oil & Gas Exploration & Production Select Industry IndexMore on XOP
Every number below is on this page. Open what you need.Price, 1 year
$200.37+0.2%1 day, priceClose, Oct 28, 2026
Price only. Total return over the same days, distributions reinvested, was +62.5%. Computed by ETFIQ from Tiingo daily prices.
Source: Tiingo end-of-day prices. Data as of Oct 28, 2026. Updated every trading night. Last checked Oct 19, 2026. Report a data error
| Window | Total return |
|---|---|
| 1M Sep 28 – Oct 28, 2026 | +11.2% |
| 3M Jul 29 – Oct 28, 2026 | +16.9% |
| 6M Apr 29 – Oct 28, 2026 | +13.8% |
| YTD Dec 31, 2025 – Oct 28, 2026 | +60.8% |
| 1Y Oct 28, 2025 – Oct 28, 2026 | +62.5% |
| 3Y Oct 27, 2023 – Oct 28, 2026 | +49.2% |
| 5Y Oct 29, 2021 – Oct 28, 2026 | +112.3% |
| 10Y Oct 28, 2016 – Oct 28, 2026 | +68.1% |
| Since launch Jun 22, 2006 – Oct 28, 2026 | +92.7% |
| Since launch, annualised Jun 22, 2006 – Oct 28, 2026 | +3.3% |
Total returns, distributions reinvested.
Source: Tiingo end-of-day prices, with distributions reinvested.
Money in and out
Daily data · as of Oct 22, 2026XOP: in the year to Oct 22, 2026, net $1.1bn came in; in the month to Oct 22, 2026, $92.8m went out.
Oct 21, 2026 to Oct 22, 2026
Sep 28, 2026 to Oct 22, 2026
Jul 28, 2026 to Oct 22, 2026
Jan 2, 2026 to Oct 22, 2026
round trip, net −$55.2m
Oct 28, 2025 to Oct 22, 2026
round trip, net −$55.2m
SEC filings, then daily counts
XOP, net flow each trading day over the 62 sessions from Jul 28, 2026 to Oct 22, 2026: money came in on 28 days and went out on 31 days.
Money in on 28 of the 62 trading days, out on 31.
XOP, net flow each trading day over the 248 sessions from Oct 28, 2025 to Oct 22, 2026: money came in on 124 days and went out on 107 days.
Money in on 124 of the 248 trading days, out on 107.
XOP, net flow each trading day over the 400 sessions from Mar 21, 2025 to Oct 22, 2026: money came in on 191 days and went out on 177 days.
Money in on 191 of the 400 trading days, out on 177.
Computed by ETFIQ from State Street’s daily data: each day’s change in shares outstanding times the previous day’s net asset value. Round trips: $195m came in on Jan 30, 2026 and $245m went out on Feb 4, 2026; $157m came in on Feb 27, 2026 and $136m went out on Mar 3, 2026; $182m came in on Jul 14, 2026 and $182m went out on Jul 15, 2026. A creation undone within days moves money in and straight back out, so it says little about what investors wanted. Both days stay in every total and are marked in the tables and the drawings.
How this is computed
Percentages are of net assets at the start of each window. Numbers are net: money in less money out. Checked against the filing: The month’s daily sum and the filing’s B.6 number agree within rounding or, where the filing’s is larger, within rounding plus the fund’s creation and redemption fees. The full rule is in the fund’s flows file. Every day and month ETFIQ holds for XOP, back to Jul 2019, is in its flows file. Flows across every fund · How these flows are computed · Compare XOP with other funds in the flows tool
Every trading day, last 3 months62 days
Most recent first.
Week by week, last year52 weeks
Net flow into XOP each week, Oct 28, 2025 to Oct 22, 2026, most recent first, each week named by its last trading day with data. Computed by ETFIQ.
Month by month, money in and money outNov 2023 to Oct 2026
XOP, money in and money out each month from Nov 2023 to Sep 2026: two bars a month, money in above the line and money out below. Bars for Nov 2023 to Jun 2026 are from XOP’s SEC filings (N-PORT item B.6), and for Jul 2026 to Sep 2026 ETFIQ’s sums of its days. Oct 2026 is still in progress, so it is in the list and not drawn. Of the 36 months listed, money came in on net in 16 and went out in 20.
Bars for Nov 2023 to Jun 2026 are from XOP’s SEC filings (N-PORT item B.6), and for Jul 2026 to Sep 2026 ETFIQ’s sums of its days. Of the 36 months listed, money came in on net in 16 and went out in 20.
Most recent first.
How this is computed
N-PORT months: money in is sales plus reinvestments; money out is redemptions. Months summed from daily data: money in adds the days money came in; money out adds the days it went out.
N-PORT months are the filed sales plus reinvestments less redemptions. Later months add up the daily data; the Source column names any missing day.
Source: ETFIQ, from the fund’s daily share counts and net asset values, and its SEC N-PORT filings. Data as of Oct 22, 2026.
XOP key stats
Trading
as of Oct 27, 2026
Also against XLF, XLV, DIA, VBR, JAAA, VXF, FNDX, USHY, XLU, XLY, SPMO, TIP, XLP, VBIL, EWT, NOBL, FENI, VDE, CGBL, IJS, SPYD, SIVR, OIH, USO, IXC, FENY, IYE, FTXN, IVV, VTI, QQQ, VUG, VEA, IEFA, SPYM, VTV, VXUS, BND, VGT, IEMG, AGG, GLD, VWO, IJH, SGOV, SCHD, QQQM, VIG, ITOT, IWD, BNDX, VT, VYM, EFA, IWM, SCHX, SCHF, VEU, VCIT, SCHG, IAU, SPYG, MUB, IUSB, VTEB, IWB, BIL, QUAL, TLT, VONG, BSV, DGRO, SCHB, VCSH, IEF, GOVT, DYNF, VGIT, CGDV, VNQ, MBB, VGSH, MGK, IDEV, ACWI, AVUV, XLI, GLDM, LQD, VGK, EEM, VOOG, SHY, AVEM, EMXC, SLV, MDY, CGGR, RDVY, IYW, EWY, USMV, EWJ, IGSB, DVY, VBK, VOE, AVLV, FTEC, XLC, SDY, SHV, VYMI, VTIP, DFUS, AVDV, COWZ, IGIB, VHT, SPHQ, MTUM, ACWX, HYG, IEI, BINC, VTWO, HDV, AVUS, BOXX, PVAL, IWO, EMB, XLG, PFF, SPSB, SCHH, IGM, IBB, ONEQ, VGLT, XBI, EWZ, FDVV, VUSB, VLUE, EZU, VPL, URTH, XLB, XLRE, PDBC, VPU, FBCG, VCLT, IJT, VDC, VOX, JNK, INDA, HGER, GRNY, KRE, AOR, IYR, HYMB, FXI, EDV, GARP, MLPX, ILF, SPHD, MLPA, BITO, XHB, IWC, XRT, PULS, USFR, DGRW, SCHP, MINT, MOAT, BOND, MAGS, XOVR, FLKR, BWET.
About XOP
12 seats on XOP, as of Oct 28, 2026: 1 Supports, 4 Challenges, 7 Not enough data.
Questions people ask about XOP
- How has XOP performed?
- Over the year to Oct 28, 2026, XOP returned +62.5% with distributions reinvested. Over three years the number is +49.2%.
- What does XOP cost?
- The prospectus expense ratio is 0.35% a year.
- How far is XOP below its high?
- 24.8% below its high of Jun 23, 2014, measured on the reinvested series to Oct 28, 2026.
- What are the holdings of XOP?
- Its largest holdings on Oct 27, 2026 are RRC 3.5%, APA 2.9%, MUR 2.9%, OVV 2.8%, EOG 2.8%, of 52 listed.
Links are sources, not endorsements.
Cite this pageCitation, APA and Markdown
ETFIQ, XOP, stock fund, data as of Oct 28, 2026. https://etfiq.com/funds/xop
ETFIQ. (Oct 28, 2026). XOP, stock fund. Retrieved from https://etfiq.com/funds/xop
[XOP, stock fund (ETFIQ, Oct 28, 2026)](https://etfiq.com/funds/xop)
Free to use with attribution for data ETFIQ computes; issuer data stays under its owner's terms. The underlying files are at Open data.
Embed this chart
Free to use with the credit link. Paste this where the chart should go; it updates every trading night.
<figure style="margin:0;max-width:640px">
<a href="https://etfiq.com/funds/xop"><img src="https://etfiq.com/assistant/api/embed/core/xop.svg" alt="XOP: XOP over 1 year: total return +62.5%. Data to Oct 28, 2026." width="640" style="max-width:100%;height:auto"></a>
<figcaption style="font:13px/1.5 sans-serif">XOP: XOP over 1 year: total return +62.5%. Data to Oct 28, 2026. Data: <a href="https://etfiq.com/funds/xop">ETFIQ</a></figcaption>
</figure>The day's ETF flows, a comparison and one number. Every trading morning. About the Daily
Snapshot, Oct 28, 2026. More on the tabs above.