
RBTX iShares Future Robotics and Related Technologies Active ETF

From its Oct 21, 2026 launch to Oct 27, 2026, RBTX lost 0.8%.

Holds 41 stocks in robotics and automation, 34% of its weight in S&P 500 companiesiShares ↗Expense ratio 0.65%Fund assets $9.8m on Oct 26, 2026First traded Oct 21, 2026Benchmark Its own holdings, as of Oct 26, 2026; its prospectus names no index it tracksFund page at the issuer ↗SEC filings ↗Every iShares fund ETFIQ covers

RBTX risk and return scorecard

Not measured: no scorecard was computed for this fund.

Method

What you earned

RBTX −0.8%: total return since launch to Oct 27, 2026.
RBTX−0.8%

What can be shown yet

First traded Oct 21, 2026
33.5%
Already in the S&P 500
85.2%
Active share vs the S&P 500
40.7%
Top ten holdings
−0.8%
Total return, since launch
RBTX has traded for 6 days. Numbers that need a year of prices are not shown yet.
Shown now
First tradedOct 21, 2026
Outside the S&P 500, by weight66%
Already in the Nasdaq-100, by weight28.5%
Active share vs the Nasdaq-10079.3%
Not yet
One-year returnfrom Oct 21, 2027
Three-year returnfrom Oct 21, 2029

More on RBTX

Every number below is on this page. Open what you need.

No S&P 500 Difference Score.

Why

RBTX has the number, but 33.5% of its money is in S&P 500 companies, under the 50% that makes the S&P 500 a fair index to measure it against. A fund outside a ranked set has no score rather than a low one. All thematic ETFs ranked by it · How it is computed

The week's ETF fund flows, by email on Sundays.

One-click unsubscribe. See Privacy.

RBTX returns by window: total return, cash paid and price change
WindowTotal returnS&P 500 (SPY)
Since launch Oct 21 – Oct 27, 2026−0.8%−0.4%

Total returns, distributions reinvested. Listed Oct 2026: no 1 month, 3 months, 6 months, year to date, 1 year and 3 years windows.

Source: Tiingo end-of-day prices, with distributions reinvested. Data as of Oct 27, 2026. Updated every trading night. Report a data error

RBTX key stats

High since Oct 21, 2026, daily closes to Oct 27, 2026 (ETFIQ)$25.57 on Oct 21, 2026
Low since Oct 21, 2026, daily closes to Oct 27, 2026 (ETFIQ)$24.03 on Oct 22, 2026
Close on Oct 27, 2026, within that range (ETFIQ)$25.36, 86% of the way from the low to the high
Holdings41
Top ten holdings weight40.7%
Range, beta and R-squared computed by ETFIQ from Tiingo daily prices.

Trading

as of Oct 27, 2026
Trading · RBTXas of Oct 27, 2026
·
Too new to score0 of 6 measured · Oct 27, 2026
0 · Hard to tradeIQ Liquidity Score100 · Trades like a giant
Cost for your order · one way, half its 30-day median spread
Premium or discount to NAV, Oct 27 close+0.31%
−0.8%95% of days within ±0.56% · the 1% band is off this scale+0.8%
How to tradeSpread not read.
Full trading page: components, premium history, dealers →

RBTX top ten by weight, 40.7% of the fund, of its 41 equity positions, from the holdings published by its issuer for Oct 26, 2026. Source: the issuer’s own daily file.

Source: iShares’s daily holdings file. Data as of Oct 26, 2026. Updated each trading day. Last checked Oct 27, 2026. Report a data error

About RBTX

Theme (ETFIQ, editorial)Robotics and automation
First tradedOct 21, 2026
Already in the S&P 500, by weight (ETFIQ)33.5%
Outside the S&P 500, by weight (ETFIQ)66%
Active share vs the S&P 500 (ETFIQ)85.2%
Already in the Nasdaq-100, by weight (ETFIQ)28.5%
Active share vs the Nasdaq-100 (ETFIQ)79.3%
Top ten holdings weight40.7%
Holdings41
Holdings published for (the issuer’s daily file)Oct 26, 2026
Holdings as of the close of (the issuer’s daily file)Oct 26, 2026
Top holdingsTESLA INC 5.7%, ADVANCED MICRO DEVICES 5.0%, NVIDIA 4.7%, COGNEX 4.2%, SPACE EXPLORATION TECHNOLOGIES COR 4.2%, LINCOLN ELECTRIC HOLDINGS 3.6%, DAIFUKU 3.4%, LATTICE SEMICONDUCTOR 3.4%, ARM HOLDINGS AMERICAN DEPOSITARY S 3.4%, METSO CORPORATION 3.2%
Net assets (the issuer’s own daily fund list, as of Oct 26, 2026)$9.8mReport
Benchmark (ETFIQ, from its filings)Its own holdings, as of Oct 26, 2026; its prospectus names no index it tracks
Below its all-time high (ETFIQ)−0.8%
Expense ratio (485BPOS XBRL, Oct 14, 2026)0.65%Report
Fee for the part that differs from the S&P 500, active expense ratio (ETFIQ)0.76%
Closest funds by holdings overlapAIX 33%, BAI 30%, XIGV 29%, SOXQ 26%, XSD 25%
How we measure
Holdings from the file the issuer publishes daily; overlap and active share computed by ETFIQ against the IVV and QQQM books; returns from Tiingo end-of-day prices with distributions reinvested. Method
IQ Investment Committee on RBTX

Three seats on RBTX, as of Oct 27, 2026.

Put RBTX to the committee →See all seats →No investor named is affiliated with or endorses ETFIQ. Not investment advice.

Questions people ask about RBTX

How much of RBTX is in S&P 500 companies?
By its holdings published by its issuer for Oct 26, 2026, 34% of RBTX by weight is stocks the S&P 500 already holds. Its active share against the index is 85%, so that share is the part doing something different.
What does RBTX hold?
41 positions as published by its issuer for Oct 26, 2026, with the top ten at 41% of the fund. The largest are TESLA INC at 5.7%, ADVANCED MICRO DEVICES at 5.0%, NVIDIA at 4.7%.
Has RBTX beaten the S&P 500?
Since it first traded on Oct 21, 2026, RBTX returned −0.8% with distributions reinvested, against −0.4% for the S&P 500, so it finished about even with the index by 0.4 points.
What does RBTX cost?
The prospectus expense ratio is 0.65% a year. Because 85% of the fund differs from the S&P 500, the fee on that differing part works out at 0.76%.
Sources and dates
Prices, RBTX and S&P 500 (SPY)Tiingo end-of-day · Oct 27, 2026
Net assets, $9.8mThe issuer’s own daily fund list · Oct 26, 2026

Links are sources, not endorsements.

Cite this pageCitation, APA and Markdown

ETFIQ, RBTX, thematic ETFs, data as of Oct 27, 2026. https://etfiq.com/funds/rbtx

The difference bar for RBTX, redrawn every trading night.

Free to use with attribution for data ETFIQ computes; issuer data stays under its owner's terms. The underlying files are at Open data.

How differently the money is placed, counting weights: one minus the sum of the smaller weight of each security across the fund and the index. 100% means nothing in common; 0% means the index itself. Two funds can hold the same names and still have a high active share if they weight them very differently.
Weight overlap
The share of money two portfolios hold in the same securities at the same weight.
Already in the index
The fund’s weight in securities the S&P 500 holds at all. A fund can be made entirely of index names and still have high active share, because it holds them at different weights.
The weight of the ten largest holdings. Above 50% the fund is a bet on a handful of companies, whatever the theme.
Embed this chart

Free to use with the credit link. Paste this where the chart should go; it updates every trading night.
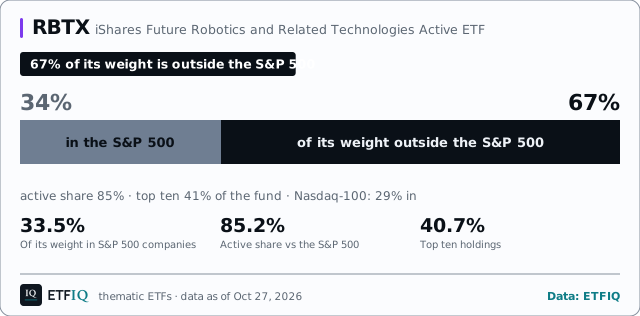
RBTX: 34% of RBTX's weight is in S&P 500 companies and 67% is outside the index. Holdings as of Oct 26, 2026.
<figure style="margin:0;max-width:640px">
<a href="https://etfiq.com/funds/rbtx"><img src="https://etfiq.com/assistant/api/embed/themes/rbtx.svg" alt="RBTX: 34% of RBTX&#x27;s weight is in S&amp;P 500 companies and 67% is outside the index. Holdings as of Oct 26, 2026." width="640" style="max-width:100%;height:auto"></a>
<figcaption style="font:13px/1.5 sans-serif">RBTX: 34% of RBTX&#x27;s weight is in S&amp;P 500 companies and 67% is outside the index. Holdings as of Oct 26, 2026. Data: <a href="https://etfiq.com/funds/rbtx">ETFIQ</a></figcaption>
</figure>

How to embed ETFIQ charts

Get the weekly ETF note

Four ranked ETF lists in one email every Friday morning. The last note

Confirm from the link that arrives, and unsubscribe in one click. See Privacy.

Snapshot, Oct 27, 2026. More on the tabs above.