


Uranium and nuclear ETFs: all 10 compared
See every nuclear and uranium ETF by what it holds, not by its name. Funds that hold uranium miners, reactor builders and the utilities that run nuclear plants. They are one category here because the funds are: the largest holding of the reactor funds and of the uranium funds is the same company, Cameco. 10 funds, largest first. Updated Oct 21, 2026. The typical fund carries 16% of its weight in S&P 500 names, the 41st most of the 53 themes with filed books.
The short answers
What these funds actually own
Between them the 10 funds' ten largest holdings name 71 companies, of which 19 appear in more than one. Oklo Inc is among the ten largest of 3 of them, at an average of 5.2% of the fund.
Nuclear and uranium ETFs, the companies their ten largest holdings name. The 15 most widely held of 71. Source: each fund's latest SEC filing or its issuer’s own daily holdings file, read by ETFIQ.
How this is counted
Each row counts the ten largest holdings of each fund, so a fund missing from a row may still hold that company lower down. Weights are of the funds that name it, not of the theme.
Share of each fund's weight in S&P 500 companies. Above half, the fund is mostly the S&P 500.
White marker is the S&P 500 over the same days, +16.4%, for reference. Last column is the gap to the fund's own benchmark, in points.
The 10 largest nuclear and uranium ETFs
ETFIQ covers 10 nuclear and uranium ETFs. The largest are URA ($5.4bn), NLR ($3.1bn) and URNM ($1.7bn); fees run 0.35% to 0.85%, as of .
- 1URA$5.4bn0.69%Global X Uranium ETF
- 2NLR$3.1bn0.52%VanEck Uranium and Nuclear ETF
- 3URNM$1.7bn0.75%Sprott Uranium Miners ETF
- 4NUKZ$890m0.85%Range Nuclear Renaissance Index ETF
- 5URNJ$293m0.80%Sprott Junior Uranium Miners ETF
- 6RCTR$29m0.70%First Trust Bloomberg Nuclear Power ETF
- 7URAN$28m0.35%Themes Uranium & Nuclear ETF
- 8SMRF$11m0.65%ALPS Nautilus SMR, Nuclear & Technology ETF
- 9UX$4m0.77%Roundhill Uranium ETF
- 10TNUK$2m0.75%Tortoise Nuclear Renaissance ETF
Every nuclear and uranium ETF, largest first
Click a column to sortPoints (pts) are percentage points.
| Ticker | Fund | Issuer | Net assets ↓ | In the S&P 500 | Active share | Total return 1Y | vs its benchmark 1Y | Fee |
|---|---|---|---|---|---|---|---|---|
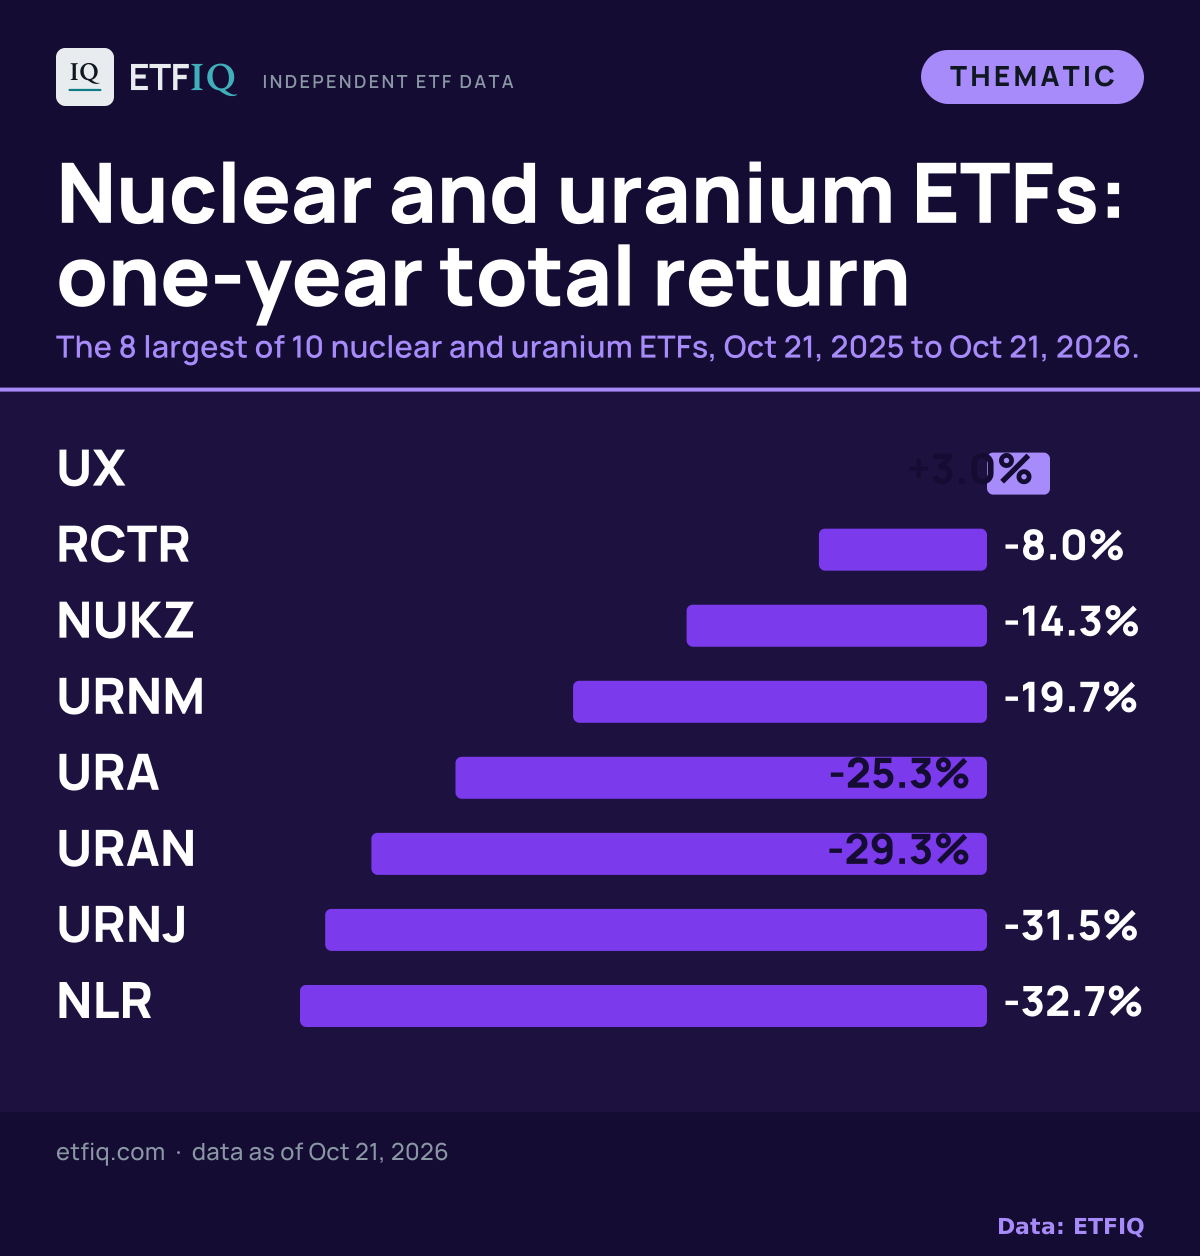
| URA | Global X Uranium ETF → | Global X | $5.4bn | 0.0% | 100.0% | −25.3% | −41.3 pts vs ACWI | 0.69% |
| NLR | VanEck Uranium and Nuclear ETF → | VanEck | $3.1bn | 15.1% | 99.8% | −32.7% | −48.8 pts vs ACWI | 0.52% |
| URNM | Sprott Uranium Miners ETF → | Sprott | $1.7bn | 0.0% | 100.0% | −19.7% | not measured | 0.75% |
| NUKZ | Range Nuclear Renaissance Index ETF → | Range | $890m | 23.0% | 98.7% | −14.3% | −30.4 pts vs ACWI | 0.85% |
| URNJ | Sprott Junior Uranium Miners ETF → | Sprott | $293m | 0.0% | 100.0% | −31.5% | not measured | 0.80% |
| RCTR | First Trust Bloomberg Nuclear Power ETF → | First Trust | $29m | 30.5% | 98.9% | −8.0% | −24.1 pts vs ACWI | 0.70% |
| URAN | Themes Uranium & Nuclear ETF → | Themes | $28m | 24.1% | 99.5% | −29.3% | −45.4 pts vs ACWI | 0.35% |
| SMRF | ALPS Nautilus SMR, Nuclear & Technology ETF → | ALPS | $11m | 27.8% | 92.5% | first traded 244 days ago | · | 0.65% |
| UX | Roundhill Uranium ETF → | Roundhill | $4m | 0.0% | 100.0% | +3.0% | not measured | 0.77% |
| TNUK | Tortoise Nuclear Renaissance ETF → | Tortoise | $2m | 17.4% | 99.2% | first traded 307 days ago | · | 0.75% |
How much of each pair is the same fund
The closest pair is NLR and SMRF, which hold 55% of their weight in the same companies. The furthest apart is URNJ and UX at 0%. The middle pair of the 45 is 27%.
Nuclear and uranium ETFs, the share of each pair’s weight held in the same companies. Read across or down; the figure is the same either way. Cells are shaded against the closest pair here, 55%. Source: each fund’s own filed or daily holdings, read by ETFIQ.
How to read the grid
Weight overlap adds the smaller of the two weights for every company both funds hold. Funds with a cut-short book are left out, not compared short.
What each fund holds alone
The largest holding no other fund in the grid holds, and how much of the fund is in names none of the others own.
Nuclear and uranium ETFs, the largest holding no other fund in the grid holds. Source: ETFIQ.
Questions people ask
- How many nuclear and uranium ETFs are there?
- ETFIQ covers 10 US listed nuclear and uranium ETFs as of Oct 21, 2026. That is every one it can measure from the fund’s own published holdings.
- What is the largest nuclear and uranium ETF?
- URA, Global X Uranium ETF, at $5.4bn in net assets as of Oct 12, 2026, the largest of the 10 nuclear and uranium ETFs with a published size.
- What is the cheapest nuclear and uranium ETF?
- URAN, Themes Uranium & Nuclear ETF, at 0.35% a year by its prospectus filed Jan 27, 2026, the lowest fee of the 10 nuclear and uranium ETFs that publish one.
- Which nuclear and uranium ETF has performed best over the past year?
- UX, Roundhill Uranium ETF, at +3.0% total return over the year to Oct 21, 2026, the highest of the 8 nuclear and uranium ETFs with a full year of trading behind them. Past returns do not predict future ones.
- What do nuclear and uranium ETFs hold?
- Funds that hold uranium miners, reactor builders and the utilities that run nuclear plants. They are one category here because the funds are: the largest holding of the reactor funds and of the uranium funds is the same company, Cameco. Between them the 10 nuclear and uranium ETFs ETFIQ can read name 71 companies in their ten largest holdings, by holdings dated May 31, 2026 to Oct 21, 2026, most widely Oklo Inc, which is among the ten largest of 3 of them.
- Do nuclear and uranium ETFs hold the same companies?
- It depends which two. Across the 45 pairs of the 10 nuclear and uranium ETFs with a full published book, by holdings dated May 31, 2026 to Oct 21, 2026, NLR and SMRF hold 55% of their weight in the same companies, URNJ and UX hold 0%, and the middle pair holds 27%. Two funds sold on one theme are not the same fund.
What the issuers say about this theme
About these links
The issuers behind these nuclear and uranium funds publish their own work on this theme. These are their pages and words, not ETFIQ’s. A fund company writing about a theme it sells is making a case.
Issuer material on this theme. Links leave ETFIQ. Source: each issuer’s own site.
ETFIQ links to the documents behind every figure; a link is not an endorsement. Standards and sources →
Embed this chart
Free to use with the credit link. Paste this where the chart should go; it updates every trading night.
<figure style="margin:0;max-width:640px">
<a href="https://etfiq.com/themes/nuclear"><img src="https://etfiq.com/assistant/api/embed/theme/nuclear.svg" alt="Nuclear and uranium ETFs, one-year total return to Oct 21, 2026: UX +3.0%, RCTR −8.0%, NUKZ −14.3%, URNM −19.7%, URA −25.3%, URAN −29.3%, URNJ −31.5%, NLR −32.7%." width="640" style="max-width:100%;height:auto"></a>
<figcaption style="font:13px/1.5 sans-serif">Nuclear and uranium ETFs, one-year total return to Oct 21, 2026: UX +3.0%, RCTR −8.0%, NUKZ −14.3%, URNM −19.7%, URA −25.3%, URAN −29.3%, URNJ −31.5%, NLR −32.7%. Data: <a href="https://etfiq.com/themes/nuclear">ETFIQ</a></figcaption>
</figure>Cite this pageCitation, APA and Markdown
ETFIQ, Uranium and nuclear ETFs: all 10 compared, data as of Oct 21, 2026. https://etfiq.com/themes/nuclear
ETFIQ. (Oct 21, 2026). Uranium and nuclear ETFs: all 10 compared. Retrieved from https://etfiq.com/themes/nuclear
[Uranium and nuclear ETFs: all 10 compared (ETFIQ, Oct 21, 2026)](https://etfiq.com/themes/nuclear)
Free to use with attribution for figures ETFIQ computes; issuer data stays under its owner's terms. The underlying files are at Open data.