
URAN Themes Uranium & Nuclear ETF

Share ▾
Share on XDownload as PDF
$32.93
+1.6% · 1 day, price
IQ’s readingComputed nightly from ETFIQ data. Not written live.

Over the year to Oct 28, 2026, URAN lost 33.2%, against 13.4% for ACWI.

Holds 49 stocks in nuclear and uranium, 22% of its weight in S&P 500 companiesThemes ↗Expense ratio 0.35%Fund assets $23m on Oct 28, 2026First traded Sep 24, 2024Benchmark MSCI ACWI Index, measured by ACWI, which tracks the same indexFund page at the issuer ↗SEC filings ↗Every Themes fund ETFIQ coversDividend history

Promise check: Not measuredIts theme exposure is measured once ETFIQ defines its theme company by company.

URAN risk and return scorecard

vs ACWI · Oct 2024 to Oct 2026 · 107 weekly returns · dividend-adjusted

Short history · 25 months
URAN +6.2%, ACWI +35.4%, Oct 2024 to Oct 2026, distributions reinvested.
Return
MeasureURANACWIEdge
Total return+6.2%+35.4%ACWI
Annualized+3.0%+15.9%ACWI
Price return+3.3%+31.2%ACWI
Risk
MeasureURANACWIEdge
Volatility36.6%14.1%ACWI
Max drawdown−39.1%−14.3%ACWI
Upside capture162.1%100.0%URAN
Downside capture145.3%100.0%ACWI
Risk-adjusted
MeasureURANACWIEdge
Sharpe ratio0.150.83ACWI
Sortino ratio0.221.23ACWI
Alpha vs ACWI
MeasureURANACWIEdge
Alpha, a year−11.0%Not significant
Alpha t-stat−0.51
Beta to ACWI1.411.00Higher beta

Computed by ETFIQ from Tiingo daily prices and ETFIQ's distribution records; risk-free rate: U.S. Treasury, Daily Treasury Bill Rates, 13-week coupon equivalent Method · Data

Money in and out

Net fund flows · Jun 30, 2026
12 months to Jun 30, 2026
+$20.4m
Since Sep 2024
+$29.7m

What you earned

URAN −6.5%, ACWI −0.3%: total return over one month to Oct 28, 2026.
URAN−6.5%
ACWI−0.3%
URAN −7.1%, ACWI +4.4%: total return over three months to Oct 28, 2026.
URAN−7.1%
ACWI+4.4%
URAN −27.2%, ACWI +7.4%: total return over six months to Oct 28, 2026.
URAN−27.2%
ACWI+7.4%
URAN −20.7%, ACWI +13.2%: total return over the year to Oct 28, 2026.
URAN−20.7%
ACWI+13.2%
URAN −33.2%, ACWI +13.4%: total return over one year to Oct 28, 2026.
URAN−33.2%
ACWI+13.4%
URAN +23.0%, ACWI +38.1%: total return since launch to Oct 28, 2026.
URAN+23.0%
ACWI+38.1%

What did you actually buy?

Nuclear and uranium · holdings as of Oct 28, 2026
21.9%
Already in the S&P 500
99.5%
Active share vs the S&P 500
45.4%
Top ten holdings
−33.2%
Total return, 1 year
2.1%
12-month yield, capital gains included, on its starting price
$1.0643
Last payment, ex-date Dec 18, 2025
Share already in the S&P 500
21.9% of the fund by weight, holdings as of Oct 28, 2026.
Ten largest holdings
Cameco Corp8.5%
Constellation Energy Corp8.5%
NAC Kazatomprom JSC4.6%
American Electric Power Co Inc4.0%
Duke Energy Corp4.0%
China National Nuclear Power Co Ltd3.4%
Public Service Enterprise Group Inc3.4%
CGN Power Co Ltd3.2%
NexGen Energy Ltd3.0%
Boss Energy Ltd2.8%

More on URAN

Every number below is on this page. Open what you need.

The week's ETF fund flows, by email on Sundays.

One-click unsubscribe. See Privacy.

Price and total return, 1 year

$32.93+1.6%1 day, priceClose, Oct 28, 2026

Total return adds every distribution, reinvested. Computed by ETFIQ from Tiingo daily prices.

Source: Tiingo end-of-day prices. Data as of Oct 28, 2026. Updated every trading night. Report a data error

Points (pts) are percentage points.

URAN returns by window: total return, cash paid and price change
WindowTotal returnBenchmark (ACWI)Gap to ACWIS&P 500 (SPY)
1M Sep 28 – Oct 28, 2026−6.5%−0.3%−6.2 pts+0.9%
3M Jul 29 – Oct 28, 2026−7.1%+4.4%−11.5 pts+6.1%
6M Apr 29 – Oct 28, 2026−27.2%+7.4%−34.6 pts+9.1%
YTD Dec 31, 2025 – Oct 28, 2026−20.7%+13.2%−33.9 pts+14.1%
1Y Oct 28, 2025 – Oct 28, 2026−33.2%+13.4%−46.6 pts+13.6%
Since launch Sep 24, 2024 – Oct 28, 2026+23.0%+38.1%−15.1 pts+38.3%
Since launch, annualised Sep 24, 2024 – Oct 28, 2026+10.4%–––

Total returns, distributions reinvested. Listed Sep 2024: no 3 years windows.

Source: Tiingo end-of-day prices, with distributions reinvested.

Money in and out

Monthly data · as of Jun 30, 2026

URAN: in the month to Jun 30, 2026, net $50k went out, by its SEC filing.

12 months
+$20.4m
194.0% of $10.5m on Jun 30, 2025
Jul 1, 2025 to Jun 30, 2026
monthly, from SEC filings
Since Sep 2024
+$29.7m
Sep 1, 2024 to Jun 30, 2026
monthly, from SEC filings

Computed by ETFIQ from the monthly sales and redemptions URAN files with the SEC on Form N-PORT.

How this is computed

ETFIQ reads no daily data for this fund, so its flows are monthly, and the latest month filed is Jun 2026. Every day and month ETFIQ holds for URAN, back to Sep 2024, is in its flows file. Flows across every fund · How these flows are computed · Compare URAN with other funds in the flows tool

Month by month, money in and money outSep 2024 to Jun 2026

URAN, money in and money out each month from Sep 2024 to Jun 2026: two bars a month, money in above the line and money out below. Every bar is from URAN’s SEC filings (N-PORT item B.6). Of the 22 months listed, money came in on net in 15 and went out in 2.

Every bar is from URAN’s SEC filings (N-PORT item B.6). Of the 22 months listed, money came in on net in 15 and went out in 2.

MonthInOutNet
Jun 2026 SEC Form N-PORT+$3.3m−$3.3m−$50k
May 2026 SEC Form N-PORT+$3.5m$0+$3.5m
Apr 2026 SEC Form N-PORT$0$0$0
Mar 2026 SEC Form N-PORT+$4.0m−$2.5m+$1.5m
Feb 2026 SEC Form N-PORT+$935k$0+$935k
Jan 2026 SEC Form N-PORT+$5.2m$0+$5.2m
Dec 2025 SEC Form N-PORT+$2.5m−$3.8m−$1.3m
Nov 2025 SEC Form N-PORT$0$0$0
Oct 2025 SEC Form N-PORT+$4.1m$0+$4.1m
Sep 2025 SEC Form N-PORT+$3.8m−$1.8m+$2.0m
Aug 2025 SEC Form N-PORT+$1.6m$0+$1.6m
Jul 2025 SEC Form N-PORT+$3.0m$0+$3.0m
Jun 2025 SEC Form N-PORT+$4.3m−$1.1m+$3.2m
May 2025 SEC Form N-PORT$0$0$0
Apr 2025 SEC Form N-PORT$0$0$0
Mar 2025 SEC Form N-PORT$0$0$0
Feb 2025 SEC Form N-PORT+$580k$0+$580k
Jan 2025 SEC Form N-PORT+$665k$0+$665k
Dec 2024 SEC Form N-PORT+$651k$0+$651k
Nov 2024 SEC Form N-PORT+$1.3m$0+$1.3m
Oct 2024 SEC Form N-PORT+$2.3m$0+$2.3m
Sep 2024 SEC Form N-PORT+$528k$0+$528k

Most recent first.

How this is computed

N-PORT months: money in is sales plus reinvestments; money out is redemptions.

N-PORT months are the filed sales plus reinvestments less redemptions. Later months add up the daily data; the Source column names any missing day.

Source: ETFIQ, from the fund’s SEC N-PORT filings. Data as of Jun 30, 2026. Updated when the fund files its next report.

URAN key stats

52-week high, daily closes to Oct 28, 2026 (ETFIQ)$54.71 on Jan 28, 2026
52-week low, daily closes to Oct 28, 2026 (ETFIQ)$31.07 on Oct 23, 2026
Close on Oct 28, 2026, within that range (ETFIQ)$32.93, 8% of the way from the low to the high
Holdings49
Top ten holdings weight45.4%
Range, beta and R-squared computed by ETFIQ from Tiingo daily prices.

Trading

as of Oct 27, 2026
Trading · URANas of Oct 27, 2026
·
Not scored2 of 6 measured · Oct 27, 2026
0 · Hard to tradeIQ Liquidity Score100 · Trades like a giant
Cost for your order · one way, half its 30-day median spread
$1,000$4.300.43%
$10,000$430.43%
Premium or discount to NAV, Oct 27 close−0.55%
−0.7%95% of days within ±0.55% · the 1% band is off this scale+0.7%
One dealer
How to tradeLimit: midpoint + 14¢ to buy, midpoint − 14¢ to sell.At the Oct 27 close of $32.40, that’s $32.54 to buy and $32.26 to sell.Its holdings close before New York; its price can drift from value late in the day.
Full trading page: components, premium history, dealers →

URAN top ten by weight, 45.4% of the fund, of its 49 equity positions, from the holdings published by its issuer for Oct 28, 2026. Source: the issuer’s own daily file.

Cameco Corp CCJ 8.54%
NAC Kazatomprom JSC KAP LON 4.63%
China National Nuclear Power Co Ltd 601985 SHA 3.42%
CGN Power Co Ltd 003816 SHE 3.23%
NexGen Energy Ltd NXE TSE 2.97%
Boss Energy Ltd BOE ASX 2.84%

Source: Themes’s daily holdings file. Updated each trading day. Last checked Oct 28, 2026.

About URAN

Theme (ETFIQ, editorial)Nuclear and uranium
First tradedSep 24, 2024
Already in the S&P 500, by weight (ETFIQ)21.9%
Outside the S&P 500, by weight (ETFIQ)78%
Active share vs the S&P 500 (ETFIQ)99.5%
Already in the Nasdaq-100, by weight (ETFIQ)12.4%
Active share vs the Nasdaq-100 (ETFIQ)99.2%
Top ten holdings weight45.4%
Holdings49
Holdings published for (the issuer’s daily file)Oct 28, 2026
Holdings as of the close of (the issuer’s daily file)Oct 28, 2026
Top holdingsCameco Corp 8.5%, Constellation Energy Corp 8.5%, NAC Kazatomprom JSC 4.6%, American Electric Power Co Inc 4.0%, Duke Energy Corp 4.0%, China National Nuclear Power Co Ltd 3.4%, Public Service Enterprise Group Inc 3.4%, CGN Power Co Ltd 3.2%, NexGen Energy Ltd 3.0%, Boss Energy Ltd 2.8%
Net assets (issuer daily file, as of Oct 28, 2026)$23mReport
Benchmark (ETFIQ, from its filings)MSCI ACWI Index, measured by ACWI, which tracks the same index
Benchmark named inits shareholder report, N-CSR/A, Jul 23, 2026
URAN, 1 year to Oct 28, 2026−33.2%
ACWI, the same days+13.4%
Against its benchmark, 1 year (ETFIQ)−46.6 pts
Below its all-time high (ETFIQ)−39.8%
Expense ratio (485BPOS XBRL, Jan 27, 2026)0.35%Report
Fee for the part that differs from the S&P 500, active expense ratio (ETFIQ)0.35%
Closest funds by holdings overlapNLR 57%, URNM 43%, SMRF 43%, URA 34%, TNUK 34%
Against its benchmark, 1 yearbehind by 46.6 pts
Below its all-time high39.8%, high on Jan 28, 2026
How we measure
The top ten holdings are 45% of the fund across 49 positions, as published by its issuer for Oct 28, 2026. Over the year to Oct 28, 2026 the fund returned −33.2% with distributions reinvested against +13.4% for its benchmark, the MSCI ACWI Index, so a holder was behind by 46.6 pts. It sits 39.8% below its all-time high of Jan 28, 2026.
Holdings from the file the issuer publishes daily; overlap and active share computed by ETFIQ against the IVV and QQQM books; returns from Tiingo end-of-day prices with distributions reinvested. Method
IQ Investment Committee on URAN

12 seats on URAN, as of Oct 28, 2026: 1 Mixed, 5 Challenges, 6 Not enough data.

In the tradition ofJohn BogleBogle-style Low CostChallenges
In the tradition ofBenjamin GrahamGraham-style Margin of SafetyNot enough data
In the tradition ofWarren Buffett & Charlie MungerBuffett & Munger-style QualityNot enough data
In the tradition ofPeter LynchLynch-style Growth at a Reasonable PriceNot enough data
In the tradition ofJohn TempletonTempleton-style Global ContrarianNot enough data
In the tradition ofRay DalioDalio-style All-WeatherChallenges
In the tradition ofHoward MarksMarks-style Cycles & RiskNot enough data
In the tradition ofStanley DruckenmillerDruckenmiller-style Macro & LiquidityChallenges
In the tradition ofDavid SwensenSwensen-style DiversificationChallenges
In the tradition ofCathie WoodWood-style Disruptive InnovationNot enough data
In the tradition ofJesse LivermoreLivermore-style Trend FollowingChallenges
Uses ETFIQ’s measuresThe ETFIQ SkepticETFIQ’s own seatMixed
Put URAN to the committee →See all seats →No investor named is affiliated with or endorses ETFIQ. Not investment advice.

Questions people ask about URAN

How much of URAN is in S&P 500 companies?
By its holdings published by its issuer for Oct 28, 2026, 22% of URAN by weight is stocks the S&P 500 already holds. Its active share against the index is 100%, so that share is the part doing something different.
What does URAN hold?
49 positions as published by its issuer for Oct 28, 2026, with the top ten at 45% of the fund. The largest are Cameco Corp at 8.5%, Constellation Energy Corp at 8.5%, NAC Kazatomprom JSC at 4.6%.
Has URAN beaten the S&P 500?
Over the year to Oct 28, 2026 URAN returned −33.2% with distributions reinvested, against +13.6% for the S&P 500, so it finished behind the index by 46.8 points.
What does URAN cost?
The prospectus expense ratio is 0.35% a year. Because 100% of the fund differs from the S&P 500, the fee on that differing part works out at 0.35%.
Sources and dates
Prices, URAN, Benchmark (ACWI) and S&P 500 (SPY)Tiingo end-of-day · Oct 28, 2026
Net assets, $23mIssuer daily file · Oct 28, 2026

Links are sources, not endorsements.

Cite this pageCitation, APA and Markdown

ETFIQ, URAN, thematic ETFs, data as of Oct 28, 2026. https://etfiq.com/funds/uran

The difference bar for URAN, redrawn every trading night.

Free to use with attribution for data ETFIQ computes; issuer data stays under its owner's terms. The underlying files are at Open data.

How differently the money is placed, counting weights: one minus the sum of the smaller weight of each security across the fund and the index. 100% means nothing in common; 0% means the index itself. Two funds can hold the same names and still have a high active share if they weight them very differently.
Weight overlap
The share of money two portfolios hold in the same securities at the same weight.
Already in the index
The fund’s weight in securities the S&P 500 holds at all. A fund can be made entirely of index names and still have high active share, because it holds them at different weights.
The weight of the ten largest holdings. Above 50% the fund is a bet on a handful of companies, whatever the theme.
Embed this chart

Free to use with the credit link. Paste this where the chart should go; it updates every trading night.
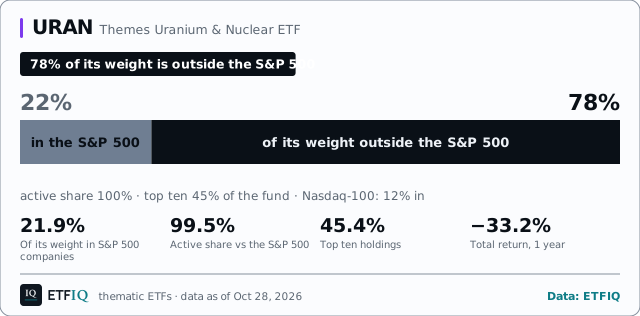
URAN: 22% of URAN's weight is in S&P 500 companies and 78% is outside the index. Holdings as of Oct 28, 2026.
<figure style="margin:0;max-width:640px">
<a href="https://etfiq.com/funds/uran"><img src="https://etfiq.com/assistant/api/embed/themes/uran.svg" alt="URAN: 22% of URAN&#x27;s weight is in S&amp;P 500 companies and 78% is outside the index. Holdings as of Oct 28, 2026." width="640" style="max-width:100%;height:auto"></a>
<figcaption style="font:13px/1.5 sans-serif">URAN: 22% of URAN&#x27;s weight is in S&amp;P 500 companies and 78% is outside the index. Holdings as of Oct 28, 2026. Data: <a href="https://etfiq.com/funds/uran">ETFIQ</a></figcaption>
</figure>

How to embed ETFIQ charts

Get the ETFIQ Daily

The day's ETF flows, a comparison and one number. Every trading morning. About the Daily

The ETFIQ Daily and our other emails. Unsubscribe from any one in a click. See Privacy.

Snapshot, Oct 28, 2026. More on the tabs above.