
Data as of Oct 27, 2026.

Theme · 30 funds

Innovation ETFs: what each one holds

See every innovation ETF by what it holds, not by its name. Funds that hold whatever their manager thinks is changing fastest, across several themes at once rather than one. 30 funds, largest first. Updated Oct 27, 2026. The typical fund carries 50% of its weight in S&P 500 stocks, the 10th most of the 53 themes with holdings on file.

askIQ about this page

askIQ about Innovation ETFs
The short answers
How many there are
30
US listed innovation ETFs, as of Oct 27, 2026.
The largest
ARK Innovation ETF, $6.2bn.
The cheapest
Invesco NASDAQ Next Gen 100 ETF, 0.15% a year.
Best one year total return
ROBO Global Healthcare Technology and Innovation ETF, +36.8%.
Least like the S&P 500
F/m Emerald Life Sciences Innovation ETF, 0.0% of its weight in S&P 500 companies.
Closest pair
33% of their weight in the same companies.

What these funds actually own

Between them the 29 funds' ten largest holdings name 226 companies, of which 38 appear in more than one.
More

NVIDIA CORP is among the ten largest of 6 of them, at an average of 6.1% of the fund.

CompanyIn the top ten ofAvg weightLargest, and where
NVIDIA CORP NVDA6 of 296.1%10.4% in AOTG
Alphabet Inc. (Class A) GOOGL5 of 295.4%9.7% in XDAT
MICROSOFT MSFT5 of 293.9%5.0% in CARZ
AMAZON.COM INC AMZN4 of 296.0%11.0% in BUYZ
Advanced Micro Devices, Inc. AMD3 of 298.4%15.4% in AOTG
ELI LILLY LLY3 of 297.0%13.3% in GDOC
TESLA INC TSLA3 of 296.8%11.0% in ARKK
NVIDIA CORP 3 of 295.8%7.2% in TNXT
Micron Technology, Inc. MU3 of 295.5%9.5% in AOTG
AppLovin Corp APP3 of 295.2%5.3% in BUYZ
SHOPIFY INC - CLASS A SHOP3 of 294.7%8.4% in BUYZ
AMAZON.COM INC 3 of 294.1%5.4% in FDCF
CROWDSTRIKE HOLDINGS CLASS A CRWD3 of 293.1%4.3% in XDAT
TAIWAN SEMICONDUCTOR MFG CO LTD 2 of 298.4%10.8% in FDCF
MICRON TECHNOLOGY INC 2 of 296.8%9.4% in FDTX

Broad innovation and megatrends ETFs, the companies their ten largest holdings name. The 15 most widely held of 226. Source: each fund's latest SEC filing or its issuer’s own daily holdings file, read by ETFIQ.

How this is counted

Each row counts the ten largest holdings of each fund, so a fund missing from a row may still hold that company lower down. Weights are of the funds that name it, not of the theme.

Share already in the S&P 500
ARKK
36.7%
XT
65.4%
QQQJ
46.6%
ILDR
66.2%
FDTX
70.8%
FRWD
69.9%
TMAT
50.3%
GTEK
33.1%
FITE
27.2%
LFSC
0.0%
AOTG
77.2%
FDCF
56.0%
DTEC
39.3%
HTEC
32.7%
TEKY
50.9%
THMZ
53.9%
LENS
21.2%
FMED
25.3%
CARZ
51.9%
FDFF
44.6%
GDOC
55.8%
TNXT
64.2%
DTRE
41.0%
INVN
32.5%
BULD
36.4%
GXDW
0.0%
BUYZ
61.5%
XDAT
60.4%
ABOT
64.4%

Share of each fund's weight in S&P 500 companies. Above half, the fund is mostly the S&P 500.

One year total return, the 27 with a full year
ARKK
−6.1%−19.7 pts vs VOO
XT
+21.9%+8.8 pts vs ACWI
QQQJ
+22.8%+9.7 pts vs IWV
ILDR
+11.0%−2.1 pts vs IWV
FDTX
+29.0%not measured
TMAT
+0.9%−12.2 pts vs ACWI
GTEK
+31.2%+18.1 pts vs ACWI
FITE
+27.8%+14.2 pts vs VOO
LFSC
+35.8%+22.7 pts vs IWV
AOTG
+7.8%−5.1 pts vs GUSA
FDCF
+0.8%not measured
DTEC
−0.5%not measured
HTEC
+36.8%not measured
TEKY
+7.5%−5.6 pts vs URTH
THMZ
+3.1%−10.0 pts vs ACWI
LENS
+31.3%+18.0 pts vs GXLC
FMED
+21.5%not measured
CARZ
+29.7%+16.6 pts vs ACWI
FDFF
−1.9%not measured
GDOC
+9.7%not measured
DTRE
+3.6%not measured
INVN
+29.0%not measured
BULD
+24.2%not measured
GXDW
−10.8%not measured
BUYZ
−18.6%−31.7 pts vs IWV
XDAT
−4.2%−17.3 pts vs IWV
ABOT
+14.2%not measured

Dark line: the S&P 500 over the same days, +13.5%. Last column: the gap to each fund's own benchmark, in points.

The 10 largest innovation ETFs

ETFIQ covers 30 innovation ETFs. The largest are ARKK ($6.2bn), XT ($4.0bn) and QQQJ ($1.2bn); fees run 0.15% to 0.79%, as of .

  1. 1ARKK$6.2bn0.75%ARK Innovation ETF
  2. 2XT$4.0bn0.46%iShares Future Exponential Technologies ETF
  3. 3QQQJ$1.2bn0.15%Invesco NASDAQ Next Gen 100 ETF
  4. 4ILDR$342m0.75%First Trust Innovation Leaders ETF
  5. 5FDTX$311m0.50%Fidelity Disruptive Technology ETF
  6. 6FRWD$285m0.65%Nomura Transformational Technologies ETF
  7. 7TMAT$237m0.79%Main Thematic Innovation ETF
  8. 8GTEK$220m0.75%Goldman Sachs Future Tech Leaders Equity ETF
  9. 9FITE$158m0.45%State Street SPDR S&P Kensho Future Security ETF
  10. 10LFSC$105m0.54%F/m Emerald Life Sciences Innovation ETF

Every innovation ETF, largest first

Click a column to sort
Net assets

Points (pts) are percentage points.

Innovation ETFs: what each one holds
TickerFundIssuerNet assets ↓In the S&P 500Active shareTotal return 1Yvs its benchmark 1YFee
ARKKARK Innovation ETFARK$6.2bn36.7%85.1%−6.1%−19.7 pts vs VOO0.75%
XTiShares Future Exponential Technologies ETFiShares$4.0bn65.4%69.2%+21.9%+8.8 pts vs ACWI0.46%
QQQJInvesco NASDAQ Next Gen 100 ETFInvesco$1.2bn46.6%98.6%+22.8%+9.7 pts vs IWV0.15%
ILDRFirst Trust Innovation Leaders ETFFirst Trust$342m66.2%66.9%+11.0%−2.1 pts vs IWV0.75%
FDTXFidelity Disruptive Technology ETFFidelity$311m70.8%75.5%+29.0%not measured0.50%
FRWDNomura Transformational Technologies ETFNomura$285m69.9%74.4%first traded 287 days ago·0.65%
TMATMain Thematic Innovation ETFMain$237m50.3%91.6%+0.9%−12.2 pts vs ACWI0.79%
GTEKGoldman Sachs Future Tech Leaders Equity ETFGoldman Sachs$220m33.1%96.4%+31.2%+18.1 pts vs ACWI0.75%
FITEState Street SPDR S&P Kensho Future Security ETFState Street$158m27.2%95.3%+27.8%+14.2 pts vs VOO0.45%
LFSCF/m Emerald Life Sciences Innovation ETFF/m$105m0.0%100.0%+35.8%+22.7 pts vs IWV0.54%
AOTGAOT Growth and Innovation ETFAOT Invest$105m77.2%69.1%+7.8%−5.1 pts vs GUSA0.75%
FDCFFidelity Disruptive Communications ETFFidelity$103m56.0%79.8%+0.8%not measured0.50%
DTECALPS Disruptive Technologies ETFALPS$74m39.3%93.4%−0.5%not measured0.50%
HTECROBO Global Healthcare Technology and Innovation ETFROBO Global$69m32.7%97.9%+36.8%not measured0.68%
TEKYLazard Next Gen Technologies ETFLazard$61m50.9%77.7%+7.5%−5.6 pts vs URTH0.50%
THMZLazard Equity Megatrends ETFLazard$54m53.9%73.5%+3.1%−10.0 pts vs ACWI0.50%
LENSSarmaya Thematic ETFSarmaya$53m21.2%97.9%+31.3%+18.0 pts vs GXLC0.79%
FMEDFidelity Disruptive Medicine ETFFidelity$52m25.3%97.1%+21.5%not measured0.50%
CARZFirst Trust S-Network Future Vehicles & Technology ETFFirst Trust$44m51.9%74.3%+29.7%+16.6 pts vs ACWI0.70%
FDFFFidelity Disruptive Finance ETFFidelity$43m44.6%97.5%−1.9%not measured0.50%
GDOCGoldman Sachs Future Health Care Equity ETFGoldman Sachs$20m55.8%95.4%+9.7%not measured0.75%
TNXTT. Rowe Price Innovation Leaders ETFT. Rowe Price$19m64.2%51.6%first traded 271 days ago·0.49%
DTREFirst Trust Alerian Disruptive Technology Real Estate ETFFirst Trust$14m41.0%99.4%+3.6%not measured0.60%
INVNAlger Russell Innovation ETFAlger$9.6m32.5%98.5%+29.0%not measured0.55%
BULDPacer BlueStar Engineering the Future ETFPacer$8.8m36.4%97.3%+24.2%not measured0.49%
GXDWGlobal X Dorsey Wright Thematic ETFGlobal X$6.0m0.0%100.0%−10.8%not measured0.50%
BUYZFranklin Disruptive Commerce ETFFranklin$5.3m61.5%86.3%−18.6%−31.7 pts vs IWV0.50%
XDATFranklin Exponential Data ETFFranklin$4.1m60.4%86.2%−4.2%−17.3 pts vs IWV0.50%
ABOTAbacus FCF Innovation Leaders ETFAbacus FCF$4.0m64.4%83.7%+14.2%not measured0.39%
ARIAARIA Opportunities ETFARIAnot read by ETFIQnot yet filednot yet filedfirst traded 78 days ago·0.78%

How much of each pair is the same fund

The closest pair is FRWD and ILDR, which hold 33% of their weight in the same companies. The furthest apart is LFSC and XT at 0%. The middle pair of the 45 is 8%. The grid is the 10 largest of 30 funds.

ARKKXTQQQJILDRFDTXFRWDTMATGTEKFITELFSCARKK
17%
3%
20%
18%
13%
6%
3%
4%
1%
XT
17%
3%
29%
24%
17%
16%
6%
11%
0%
QQQJ
3%
3%
5%
1%
0%
7%
3%
8%
3%
ILDR
20%
29%
5%
29%
33%
14%
9%
8%
2%
FDTX
18%
24%
1%
29%
29%
17%
15%
8%
0%
FRWD
13%
17%
0%
33%
29%
11%
7%
1%
0%
TMAT
6%
16%
7%
14%
17%
11%
10%
18%
1%
GTEK
3%
6%
3%
9%
15%
7%
10%
9%
0%
FITE
4%
11%
8%
8%
8%
1%
18%
9%
0%
LFSC
1%
0%
3%
2%
0%
0%
1%
0%
0%

Innovation ETFs, the share of each pair’s weight held in the same companies. Read across or down; the number is the same either way. Cells are shaded against the closest pair here, 33%. Source: each fund’s own filed or daily holdings, read by ETFIQ.

How to read the grid

Weight overlap adds the smaller of the two weights for every company both funds hold. Funds with a cut-short book are left out, not compared short.

What each fund holds alone

FundLargest holding only it hasWeightAll its own names
ARKKCIRCLE INTERNET GROUP INC CRCL4.9%
30.9%
XTTEXAS INSTRUMENT TXN4.5%
42.7%
QQQJNetApp Inc NTAP2.2%
63.3%
ILDRSiemens Energy AG ENR.GR1.5%
16.9%
FDTXTWILIO INC2.5%
14.1%
FRWDLam Research Corp.6.6%
24.9%
TMATCLEAR SECURE INC2.4%
38.2%
GTEKJENTECH PRECISION INDUSTRIAL CO LTD 36533.5%
47.0%
FITERAPID7 INC RPD3.2%
55.4%
LFSCTravere Therapeutics Inc TVTX7.7%
78.9%

Innovation ETFs, the largest holding no other fund in the grid holds. Source: ETFIQ.

Questions people ask

How many innovation ETFs are there?
ETFIQ covers 30 US listed innovation ETFs as of Oct 27, 2026. That is every one it can measure from the fund’s own published holdings.
What is the largest innovation ETF?
ARKK, ARK Innovation ETF, at $6.2bn in net assets as of Oct 26, 2026, the largest of the 29 innovation ETFs with a published size.
What is the cheapest innovation ETF?
QQQJ, Invesco NASDAQ Next Gen 100 ETF, at 0.15% a year by its prospectus filed Dec 18, 2025, the lowest fee of the 30 innovation ETFs that publish one.
Which innovation ETF has performed best over the past year?
HTEC, ROBO Global Healthcare Technology and Innovation ETF, at +36.8% total return over the year to Oct 27, 2026, the highest of the 27 innovation ETFs with a full year of trading behind them. Past returns do not predict future ones.
What do innovation ETFs hold?
Funds that hold whatever their manager thinks is changing fastest, across several themes at once rather than one. Between them the 29 innovation ETFs ETFIQ can read name 226 companies in their ten largest holdings, by holdings dated May 29, 2026 to Oct 26, 2026, most widely NVIDIA CORP, which is among the ten largest of 6 of them.
Do innovation ETFs hold the same companies?
It depends which two. Across the 45 pairs of the 10 innovation ETFs with a full published book, by holdings dated May 31, 2026 to Oct 26, 2026, FRWD and ILDR hold 33% of their weight in the same companies, LFSC and XT hold 0%, and the middle pair holds 8%. Two funds sold on one theme are not the same fund.

What the issuers say about this theme

About these links

The issuers behind these innovation funds publish their own work on this theme. These are their pages and words, not ETFIQ’s. A fund company writing about a theme it sells is making a case.

Issuer material on this theme. Links leave ETFIQ. Source: each issuer’s own site.

Where to next
Sources and dates
Fund holdings from SEC Form N-PORT and from the issuers’ own daily filessec.gov ↗
SEC EDGAR, full-text search of fund filingsefts.sec.gov ↗
SEC Form N-PORT, what a fund filed it holdssec.gov ↗
Rule 19a-1, what a distribution notice must sayecfr.gov ↗

Links are sources, not endorsements. Standards and sources →

Embed this chart

Free to use with the credit link. Paste this where the chart should go; it updates every trading night.
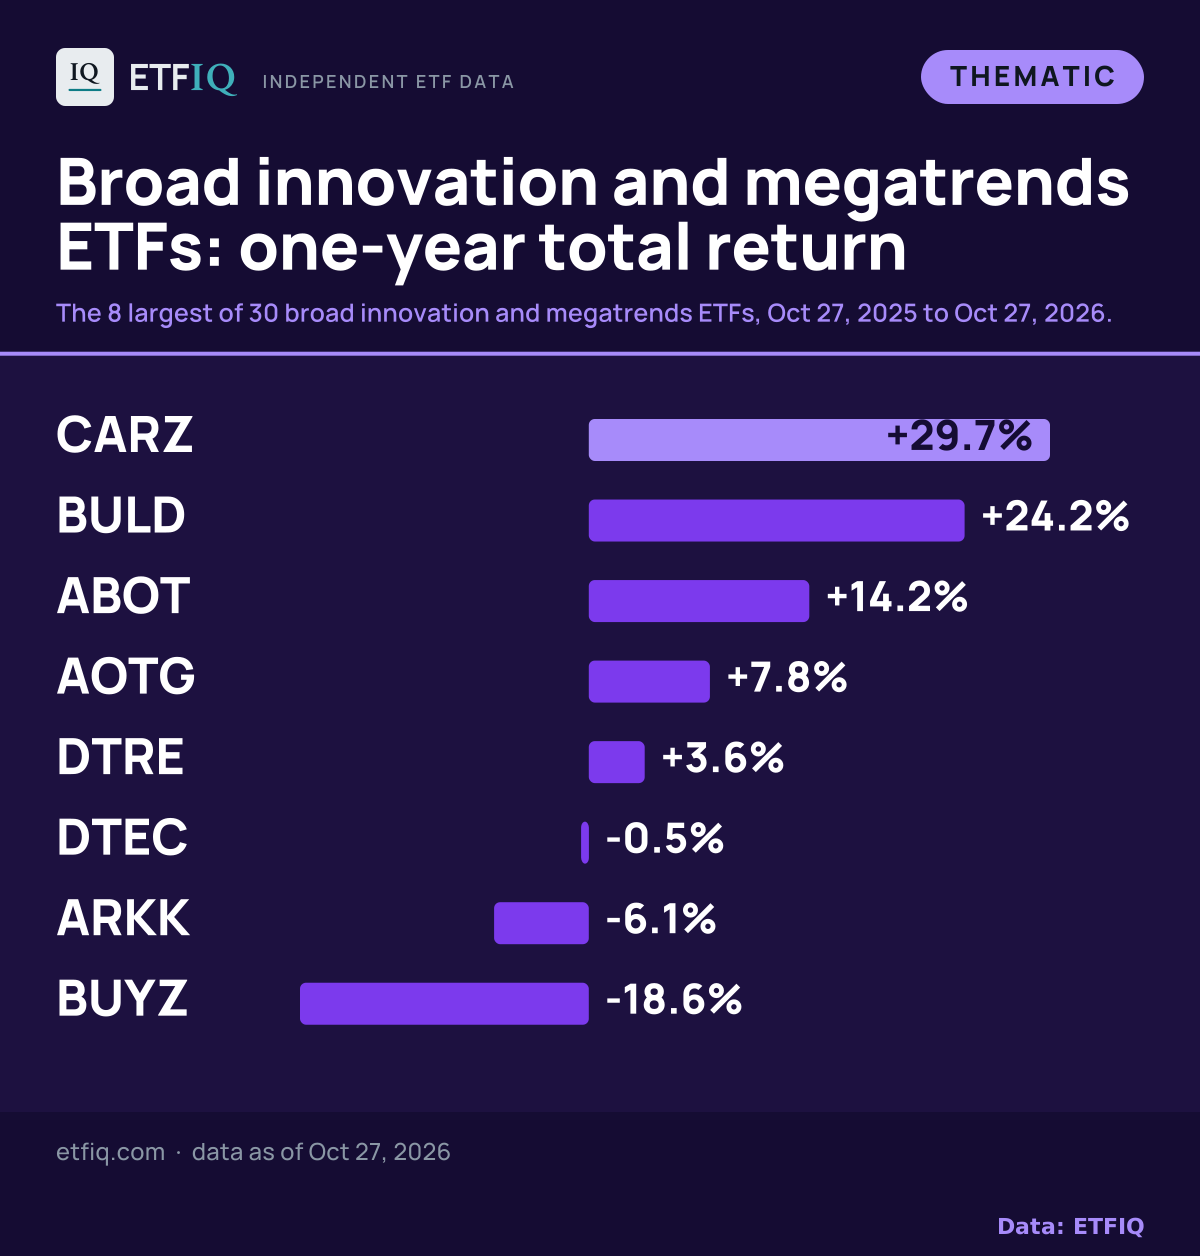
Broad innovation and megatrends ETFs, one-year total return to Oct 27, 2026: CARZ +29.7%, BULD +24.2%, ABOT +14.2%, AOTG +7.8%, DTRE +3.6%, DTEC −0.5%, ARKK −6.1%, BUYZ −18.6%.
<figure style="margin:0;max-width:640px">
<a href="https://etfiq.com/themes/innovation"><img src="https://etfiq.com/assistant/api/embed/theme/innovation.svg" alt="Broad innovation and megatrends ETFs, one-year total return to Oct 27, 2026: CARZ +29.7%, BULD +24.2%, ABOT +14.2%, AOTG +7.8%, DTRE +3.6%, DTEC −0.5%, ARKK −6.1%, BUYZ −18.6%." width="640" style="max-width:100%;height:auto"></a>
<figcaption style="font:13px/1.5 sans-serif">Broad innovation and megatrends ETFs, one-year total return to Oct 27, 2026: CARZ +29.7%, BULD +24.2%, ABOT +14.2%, AOTG +7.8%, DTRE +3.6%, DTEC −0.5%, ARKK −6.1%, BUYZ −18.6%. Data: <a href="https://etfiq.com/themes/innovation">ETFIQ</a></figcaption>
</figure>

How to embed ETFIQ charts

Cite this pageCitation, APA and Markdown

ETFIQ, Innovation ETFs: what each one holds, data as of Oct 27, 2026. https://etfiq.com/themes/innovation

Open data →

Free to use with attribution for data ETFIQ computes; issuer data stays under its owner's terms. The underlying files are at Open data.