


SBAR Simplify Barrier Income ETF
Share ▾
Embed ▾
Free to use with the credit link. It updates every trading night.
Fund card
<iframe src="https://etfiq.com/embed/fund/sbar/" title="ETFIQ SBAR analysis" width="100%" height="420" loading="lazy" style="border:0;max-width:600px"></iframe>
<p>Data: <a href="https://etfiq.com/funds/sbar">ETFIQ SBAR analysis</a></p>
Daily flows
<iframe src="https://etfiq.com/embed/flows-strip/sbar/" title="ETFIQ SBAR fund flows" width="100%" height="340" loading="lazy" style="border:0;max-width:600px"></iframe>
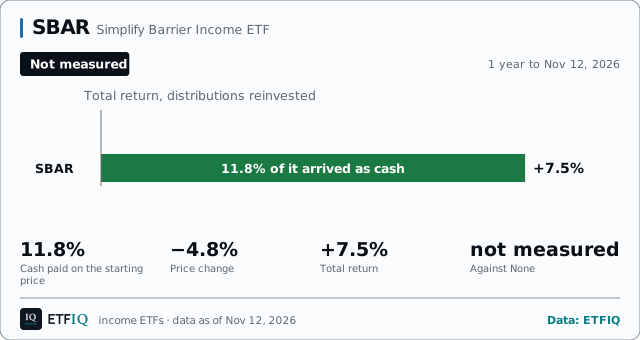
<p>Data: <a href="https://etfiq.com/funds/sbar">ETFIQ SBAR fund flows</a></p>Over the year to Nov 12, 2026, SBAR paid 11.8% in cash and returned 7.5% in total.
- 1-year total return
- +7.5%to Nov 12, 2026
- Expense ratio
- 0.77%a year
- Net assets
- $441mon Nov 11, 2026
- Net flow, latest day
- $0daily basis to Nov 11, 2026
Did what it promises: PartlyOver the year to Nov 12, 2026, SBAR paid 11.8% in cash and returned 7.5% in total, 63.6% of the cash it paid. Since launch it covered 103.7%.
SBAR, 1 year
Total return, distributions reinvested, Nov 12, 2025 to Nov 12, 2026. No second line: no ETF prices its benchmark.
SBAR risk and return scorecard
vs its benchmark
Computed by ETFIQ from Tiingo daily prices and ETFIQ's distribution records; risk-free rate: U.S. Treasury, Daily Treasury Bill Rates, 13-week coupon equivalent Method · Data
Money in and out
What you earned
Cash paid, 1 year, on its starting price to Nov 12, 2026. Return of capital, annual report, fiscal year to Jun 30, 2026 (Simplify latest estimate 76.8%, Oct 27, 2026). Hypothetical.
At SBAR’s 0.77% a year, taken each year from the amount after growth. Hypothetical.
What it paid
12 committee seats read SBAR on data as of Nov 12, 2026: 1 Supports, 0 Mixed, 4 Challenges, 7 without enough data.
- Bogle
- Graham
- Buffett & Munger
- Lynch
- Templeton
- Dalio
- Marks
- Druckenmiller
- Swensen
- Wood
- Livermore
- Skeptic
12 seats on SBAR, as of Nov 12, 2026: 1 Supports, 4 Challenges, 7 Not enough data.
Risk Officer
Risk check
What to look at before you hold SBAR. Not advice.
As of Nov 13, 2026, SBAR crossed 2 of 6 ETFIQ risk lines.
Lines and sources: Method. Check several funds at once on My Portfolio.
More on SBAR
Every number below is on this page. Open what you need.Price and total return, 1 year
$24.920.0%1 day, priceClose, Nov 12, 2026
Total return adds every distribution, reinvested. Computed by ETFIQ from Tiingo daily prices.
Source: Tiingo end-of-day prices. Data as of Nov 12, 2026. Updated every trading night. Report a data error
| Window | Total return | Cash paid | Price | Benchmark | Ahead or behind |
|---|---|---|---|---|---|
| 1M Oct 13 – Nov 12, 2026 | −0.8% | 1.0% | −1.8% | not published | not available |
| 3M Aug 13 – Nov 12, 2026 | −0.8% | 2.9% | −3.7% | not published | not available |
| 6M May 14 – Nov 12, 2026 | +2.7% | 5.8% | −3.2% | not published | not available |
| YTD Dec 31, 2025 – Nov 12, 2026 | +5.2% | 9.7% | −4.7% | not published | not available |
| 1Y Nov 12, 2025 – Nov 12, 2026 | +7.5% | 11.8% | −4.8% | not published | not available |
| Since launch Apr 15, 2025 – Nov 12, 2026 | +19.7% | 19.0% | −0.5% | not published | not available |
| Since launch, annualised Apr 15, 2025 – Nov 12, 2026 | +12.1% | – | – | – | – |
Total returns, distributions reinvested. Listed Apr 2025: no 3 years windows.
Source: Tiingo end-of-day prices, with distributions reinvested.
Money in and out
Daily data · as of Nov 11, 2026SBAR: in the 3 trading days to Nov 11, 2026, nothing net moved.
Nov 11, 2026
SBAR, net flow each trading day over the 65 sessions from Aug 12, 2026 to Nov 11, 2026: money came in on 0 days and went out on 0 days, of the 3 days with daily data; the other 62 have none. Before Nov 9, 2026 ETFIQ has the fund’s monthly data only, from SEC filings: that span is shaded and draws no bars, and its months are in the month by month list.
No money in or out. 62 days missing.
SBAR, net flow each trading day over the 251 sessions from Nov 12, 2025 to Nov 11, 2026: money came in on 0 days and went out on 0 days, of the 3 days with daily data; the other 248 have none. Before Nov 9, 2026 ETFIQ has the fund’s monthly data only, from SEC filings: that span is shaded and draws no bars, and its months are in the month by month list.
No money in or out. 248 days missing.
SBAR, net flow each trading day over the 400 sessions from Apr 10, 2025 to Nov 11, 2026: money came in on 0 days and went out on 0 days, of the 3 days with daily data; the other 397 have none. Before Nov 9, 2026 ETFIQ has the fund’s monthly data only, from SEC filings: that span is shaded and draws no bars, and its months are in the month by month list.
No money in or out. 397 days missing.
Daily data starts Nov 9, 2026.
How this is computed
Computed by ETFIQ from Simplify’s daily data: each day’s change in shares outstanding times the previous day’s net asset value. Percentages are of net assets at the start of each window. Numbers are net: money in less money out. Every day and month ETFIQ holds for SBAR, back to Nov 2026, is in its flows file. Flows across every fund · How these flows are computed · Compare SBAR with other funds in the flows tool
Every trading day, last 3 months3 days
Most recent first.
Week by week, last year1 week
Net flow into SBAR each week, Nov 9, 2026 to Nov 11, 2026, most recent first, each week named by its last trading day with data. Computed by ETFIQ.
Month by month, money in and money outNov 2026
SBAR, net flow each month from Nov 2026 to Nov 2026: money came in in 0 months and went out in 0 months.
Most recent first.
How this is computed
Months summed from daily data: money in adds the days money came in; money out adds the days it went out.
N-PORT months are the filed sales plus reinvestments less redemptions. Later months add up the daily data; the Source column names any missing day.
Source: ETFIQ, from the fund’s daily share counts and net asset values, and its SEC N-PORT filings. Data as of Nov 11, 2026. Last checked Nov 13, 2026.
SBAR key stats
SBAR return of capital and tax
Trading
as of Nov 11, 2026
SBAR for holders outside the US
13 distributions for SBAR, $0.25 to $0.28 a share and $0.25 in the middle, Oct 28, 2025 to Oct 27, 2026. 1 further ex-date is expected with no amount the issuer has declared, so it is not drawn.
SBAR pays monthly. The last distribution was $0.25 a share, which went ex on Oct 27, 2026, with payment about 2 days later. The next has not been declared. On its own cadence of about 30 days the ex-date falls near Nov 26, 2026; that date is an ETFIQ projection, not the issuer’s.
Expected distributions for SBAR. A projected row carries the fund’s own spacing forward from its last ex-date, at the last amount paid. Neither is an issuer statement. Source: ETFIQ.
Cash distributions per share for SBAR. Source: ETFIQ from Tiingo end-of-day distributions.
Source: ETFIQ, from Tiingo end-of-day distributions.
About SBAR
How we measure
Questions people ask about SBAR
- How much has SBAR paid over the last year?
- Over the year to Nov 12, 2026, SBAR paid 11.8% of its starting price in cash distributions, while the price fell 4.8%.
- How often does SBAR pay, and how much?
- SBAR pays monthly. The latest distribution annualizes to 12.0% at its price on Nov 12, 2026, which is not a promise; the next one can differ.
- Is the SBAR distribution return of capital?
- Simplify estimates 77% of the distribution paid Oct 27, 2026 was return of capital. That is a tax characterization from the fund's own 19a-1 notice, not a measure of erosion.
- When does SBAR next pay a distribution?
- SBAR pays monthly. The last distribution went ex on Oct 27, 2026 at $0.25 a share. The next is not declared; on a cadence of about 30 days the ex-date falls near Nov 26, 2026, which is an ETFIQ projection. Payment usually follows the ex-date by 2 days.
- What does SBAR cost?
- The prospectus expense ratio is 0.77% a year.
- How much of SBAR’s distribution is return of capital?
- Simplify’s Rule 19a-1 notice estimates 76.8% of the distribution paid Oct 27, 2026 was return of capital. Across its notices for distributions paid Dec 23, 2025 to Oct 27, 2026, the estimate is 76.9%. The annual report for the fiscal year to Jun 30, 2026 puts it at 19.0% of distributions. Estimates come before the fund year closes and often change.
Links are sources, not endorsements.
Cite this pageCitation, APA and Markdown
ETFIQ, SBAR, income ETFs, data as of Nov 12, 2026. https://etfiq.com/funds/sbar
ETFIQ. (Nov 12, 2026). SBAR, income ETFs. Retrieved from https://etfiq.com/funds/sbar
[SBAR, income ETFs (ETFIQ, Nov 12, 2026)](https://etfiq.com/funds/sbar)
The payout bar for SBAR, redrawn every trading night.
Free to use with attribution for data ETFIQ computes; issuer data stays under its owner's terms. The underlying files are at Open data.
Embed this chart
Free to use with the credit link. Paste this where the chart should go; it updates every trading night.
<figure style="margin:0;max-width:640px">
<iframe src="https://etfiq.com/embed/income/sbar/" title="SBAR: SBAR over 1 year: paid 11.8%, price −4.8%, total +7.5%, not measured against a benchmark. Data to Nov 12, 2026." width="640" height="370" loading="lazy" style="border:0;max-width:100%;width:100%"></iframe>
<figcaption style="font:13px/1.5 sans-serif">SBAR: SBAR over 1 year: paid 11.8%, price −4.8%, total +7.5%, not measured against a benchmark. Data to Nov 12, 2026. Data: <a href="https://etfiq.com/funds/sbar">ETFIQ</a></figcaption>
</figure>The day's ETF flows, a comparison and one number. Every trading morning. About the Daily
Snapshot, Nov 12, 2026. More on the tabs above.