
QXQ SGI Enhanced Nasdaq-100 ETF

$30.68
−0.3% · 1 day, price
Fact sheet
Share ▾
Share on XDownload as PDF
Embed ▾

Free to use with the credit link. It updates every trading night.

Fund card

<iframe src="https://etfiq.com/embed/fund/qxq/" title="ETFIQ QXQ analysis" width="100%" height="420" loading="lazy" style="border:0;max-width:600px"></iframe>
<p>Data: <a href="https://etfiq.com/funds/qxq">ETFIQ QXQ analysis</a></p>

How to embed ETFIQ charts

Over the year to Nov 12, 2026, QXQ paid 15.1% in cash and returned 12.1% in total, against 11.3% for QQQ.

1-year total return
+12.1%QQQ +11.3% to Nov 12, 2026
Expense ratio
0.98%a year
Covered call on QQQ, paying quarterlySGI ↗Expense ratio 0.98%Fund assets $82m net assets, latest filing (Aug 31, 2026)First traded Jun 14, 2024Benchmark Nasdaq-100 (QQQ)SEC filings ↗Dividend history

Did what it promises: PartlyOver the year to Nov 12, 2026, QXQ paid 15.1% in cash and returned 12.1% in total, 80.1% of the cash it paid. Since launch it covered 209.2%.

Growth of $10,000

QXQ vs QQQ, 1 year

Total return, distributions reinvested, Nov 12, 2025 to Nov 12, 2026.

QXQ $11,213 +12.1%QQQ $11,168 +11.7%Returns from daily closes. Data
Scorecard · vs QQQ

QXQ risk and return scorecard

vs QQQ · Jun 21, 2024 to Nov 6, 2026 · 124 weekly returns · dividend-adjusted

Short history · 29 months
QXQ +40.4%, QQQ +38.4%, Jun 21, 2024 to Nov 6, 2026, distributions reinvested.
MeasureQXQQQQEdge
Return
Total return+40.4%+38.4%QXQ (slight)
Annualized+15.3%+14.6%QXQ (slight)
Price return+15.6%+36.6%QQQ
MeasureQXQQQQEdge
Risk
Volatility20.3%20.6%Tie
Max drawdown−21.2%−21.3%Tie
Upside capture98.0%100.0%QQQ (slight)
Downside capture98.5%100.0%Tie
MeasureQXQQQQEdge
Risk-adjusted
Sharpe ratio0.600.56QXQ (slight)
Sortino ratio0.890.85QXQ (slight)
MeasureQXQQQQEdge
Alpha vs QQQ
Alpha, a year+0.9%Not significant
Alpha t-stat0.37
Beta to QQQ0.971.00Lower beta

Computed by ETFIQ from Tiingo daily prices and ETFIQ's distribution records; risk-free rate: U.S. Treasury, Daily Treasury Bill Rates, 13-week coupon equivalent Method · Data

Total return

What you earned

QXQ −7.2%, QQQ −7.5%: total return over one month to Nov 12, 2026.
$10,000 in QXQ would be $9,280, over one month to Nov 12, 2026.
QXQ−7.2%
QQQ−7.5%
Paid 0.0% in cash. Price −7.2%.
QXQ −5.4%, QQQ −5.9%: total return over three months to Nov 12, 2026.
$10,000 in QXQ would be $9,460, over three months to Nov 12, 2026.
QXQ−5.4%
QQQ−5.9%
Paid 0.2% in cash. Price −5.7%.
QXQ −3.8%, QQQ −4.2%: total return over six months to Nov 12, 2026.
$10,000 in QXQ would be $9,620, over six months to Nov 12, 2026.
QXQ−3.8%
QQQ−4.2%
Paid 0.5% in cash. Price −4.3%.
QXQ +12.5%, QQQ +12.4%: total return year to date, Dec 31, 2025 to Nov 12, 2026.
$10,000 in QXQ would be $11,250, year to date, Dec 31, 2025 to Nov 12, 2026.
QXQ+12.5%
QQQ+12.4%
Paid 0.8% in cash. Price +11.7%.
QXQ +12.1%, QQQ +11.3%: total return over one year to Nov 12, 2026.
$10,000 in QXQ would be $11,210, over one year to Nov 12, 2026.
QXQ+12.1%
QQQ+11.3%
Paid 15.1% in cash. Price −4.7%.
QXQ +47.7%, QQQ +45.5%: total return since launch to Nov 12, 2026.
$10,000 in QXQ would be $14,770, since launch to Nov 12, 2026.
QXQ+47.7%
QQQ+45.5%
Paid 22.8% in cash. Price +21.6%.
On an amount · hypothetical
Cash paid
$1,510
Return of capital
$0
Income
$1,510

Cash paid, 1 year, on its starting price to Nov 12, 2026. Return of capital, annual report, fiscal year to Aug 31, 2026. Hypothetical.

Fees over time · hypothetical
Fees paid
$938
Of the amount
9.4%

At QXQ’s 0.98% a year, taken each year from the amount after growth. Hypothetical.

9 distributions · latest Sep 28, 2026

What it paid

15.1%
Cash paid, 1 year, on its starting price
+12.1%
Total return, 1 year
+0.8 pts
Against QQQ
0.0%
Return of capital, annual report, fiscal year to Aug 31, 2026
$0.08
Last payment (paid quarterly), ex-date Sep 28, 2026
Pays quarterly.

12 committee seats read QXQ on data as of Nov 12, 2026: 0 Supports, 2 Mixed, 3 Challenges, 7 without enough data.

0 Supports2 Mixed3 Challenges7 Not enough data
  • Bogle
  • Graham
  • Buffett & Munger
  • Lynch
  • Templeton
  • Dalio
  • Marks
  • Druckenmiller
  • Swensen
  • Wood
  • Livermore
  • Skeptic

Watch the committee read QXQ How the committee works

12 seats on QXQ, as of Nov 12, 2026: 2 Mixed, 3 Challenges, 7 Not enough data.

In the tradition ofJohn BogleBogle-style Low CostChallenges
In the tradition ofBenjamin GrahamGraham-style Margin of SafetyNot enough data
In the tradition ofWarren Buffett & Charlie MungerBuffett & Munger-style QualityNot enough data
In the tradition ofPeter LynchLynch-style Growth at a Reasonable PriceNot enough data
In the tradition ofJohn TempletonTempleton-style Global ContrarianNot enough data
In the tradition ofRay DalioDalio-style All-WeatherNot enough data
In the tradition ofHoward MarksMarks-style Cycles & RiskNot enough data
In the tradition ofStanley DruckenmillerDruckenmiller-style Macro & LiquidityChallenges
In the tradition ofDavid SwensenSwensen-style DiversificationChallenges
In the tradition ofCathie WoodWood-style Disruptive InnovationNot enough data
In the tradition ofJesse LivermoreLivermore-style Trend FollowingMixed
Uses ETFIQ’s measuresETFIQ SkepticETFIQ’s own seatMixed
Put QXQ to the committee →See all seats →No investor named is affiliated with or endorses ETFIQ. Not investment advice.

Risk Officer

Risk check

What to look at before you hold QXQ. Not advice.

As of Nov 13, 2026, QXQ crossed 1 of 6 ETFIQ risk lines.

OverlapNot publishedNot published
Trading costNot publishedNot published
Premium or discountNot publishedNot published
Return of capitalNot publishedClear
Promise checkPartly deliveredPartly delivered: Over the year to Nov 12, 2026, QXQ paid 15.1% in cash and returned 12.1% in total, covering 80.1% of its payout. Since launch it covered 209.2%.Flag
ClosureNo closure flagClear

Lines and sources: Method. Check several funds at once on My Portfolio.

More on QXQ

Every number below is on this page. Open what you need.

The week's ETF fund flows, by email on Sundays.

One-click unsubscribe. See Privacy.

Price and total return, 1 year

$30.68−0.3%1 day, priceClose, Nov 12, 2026

Total return adds every distribution, reinvested. Computed by ETFIQ from Tiingo daily prices.

Source: Tiingo end-of-day prices. Data as of Nov 12, 2026. Updated every trading night. Report a data error

QXQ returns by window: total return, cash paid and price change
WindowTotal returnCash paidPriceQQQAhead or behind
1M Oct 13 – Nov 12, 2026−7.2%0.0%−7.2%−7.5%+0.3 pts
3M Aug 13 – Nov 12, 2026−5.4%0.2%−5.7%−5.9%+0.5 pts
6M May 14 – Nov 12, 2026−3.8%0.5%−4.3%−4.2%+0.4 pts
YTD Dec 31, 2025 – Nov 12, 2026+12.5%0.8%+11.7%+12.4%+0.1 pts
1Y Nov 12, 2025 – Nov 12, 2026+12.1%15.1%−4.7%+11.3%+0.8 pts
Since launch Jun 14, 2024 – Nov 12, 2026+47.7%22.8%+21.6%+45.5%+2.2 pts
Since launch, annualised Jun 14, 2024 – Nov 12, 2026+17.5%––––

Total returns, distributions reinvested. Listed Jun 2024: no 3 years windows.

Source: Tiingo end-of-day prices, with distributions reinvested.

Where the return came from
Price change −7.2%Cash paid 0.0%, reinvested+0.3 pts vs QQQ

3.5%

Price change −5.7%Cash paid +0.2%, reinvested+0.5 pts vs QQQ

2.9%

Price change −4.3%Cash paid +0.5%, reinvested+0.4 pts vs QQQ

0.0%

Price change −4.7%Cash paid +15.1%, reinvested+0.8 pts vs QQQ

0.0%

Price change +21.6%Cash paid +22.8%, reinvested+2.2 pts vs QQQ
52.0
IQ Income ScoreETFIQ Distribution Coverage Scorejoint 82nd of 171 · Nov 12, 2026
0.3 · lowest of 171 income ETFs not writing on a single company99.7 · highest

How much of its payouts the fund's total return covered, ranked against 171 income ETFs not writing on a single company. 100 is best. How it is computed

QXQ paid 15.1% in cash over the year and returned 12.1% in total, less than it paid out.

total return as a share of the cash paid80.1% · 52nd pct

QXQ key stats

52-week high, daily closes to Nov 12, 2026 (ETFIQ)$33.77 on Oct 6, 2026
52-week low, daily closes to Nov 12, 2026 (ETFIQ)$24.81 on Mar 30, 2026
Close on Nov 12, 2026, within that range (ETFIQ)$30.68, 66% of the way from the low to the high
Beta to its benchmark, 1 year (ETFIQ)0.99, against QQQ
R-squared, the same days (ETFIQ)0.99
Beta and R-squared measured over251 daily total returns, Nov 13, 2025 to Nov 12, 2026
Range, beta and R-squared computed by ETFIQ from Tiingo daily prices.

QXQ return of capital and tax

Return of capital, fiscal year to Aug 31, 2026 (annual report, filed Nov 9, 2026)0.0%
Options it writes (holdings as of Aug 31, 2026)Options on an index, which are Section 1256 contracts
Rule 19a-1 noticesnot read by ETFIQ
The fiscal year number is the annual report’s tax character. Not tax advice. What a 19a-1 estimate is · Income ETFs by return of capital

Trading

as of Nov 11, 2026
Trading · QXQas of Nov 11, 2026
·
Not scored2 of 6 measured · Nov 11, 2026
0 · Hard to tradeIQ Liquidity Score100 · Trades like a giant
Cost for your order · one way, half its 30-day median spread
How to tradeSpread not read.
Full trading page: components, premium history, dealers →

QXQ for holders outside the US

US tax withheld on dividends, no treaty30%
Treaty rates on dividends (IRS table, read Oct 30, 2026)65 countries, 10% to 30%
QXQ interest-related and short-term gain dividendsnot read by ETFIQ
US estate tax filing threshold, non-resident holders$60,000
Share classDistributing

QXQ is a US fund. Stock of US corporations counts as US property for a non-resident's estate. Facts from the IRS, not tax advice. How withholding and treaties work
Oct 2024Quarterly, per shareSep 2026

9 distributions for QXQ, $0.0541 to $4.6497 a share and $0.0873 in the middle, Oct 1, 2024 to Sep 28, 2026.

Latest
$0.08
Ex Sep 28, 2026 · paid about 2 days later
Annualized
1.0%
At its price on Nov 12, 2026
Trailing 12 months, at today’s price
15.9%
4 payments, ex Dec 23, 2025 to Sep 28, 2026: $4.8697
Return of capital
0.0%
Annual report, fiscal year to Aug 31, 2026
Next, projected

QXQ pays quarterly. The last distribution was $0.08 a share, which went ex on Sep 28, 2026, with payment about 2 days later.

Every distribution ETFIQ holds for QXQ (9, most recent first)
Sep 28, 2026$0.08
Jun 29, 2026$0.08
Mar 30, 2026$0.06
Dec 23, 2025$4.6497
Sep 26, 2025$0.11
Jun 26, 2025$0.0873
Mar 27, 2025$0.1546
Dec 30, 2024$0.4797
Oct 1, 2024$0.0541

Cash distributions per share for QXQ. Source: ETFIQ from Tiingo end-of-day distributions.

Source: ETFIQ, from Tiingo end-of-day distributions.

How much of what it paid out did its total return cover?

Total return as a share of the cash paid
SOLM −323.2%DFII −243.5%ETTY −224.9%BITY −224.1%EHY −182.1%BAGY −177.1%BTCI −161.3%BLOX −140.8%YBTC −117.7%YETH −114.9%ETCO −114.6%KLIP −99.5%BCCC −96.7%TLTI −93.5%BTCC −91.7%, and 1 more at this point: YBIT −88.9%LTTI −84.3%IAUI −69.2%XBTY −66.3%KGLD −65.5%GLDW −55.7%LFGY −53.2%EGGY −49.0%IGLD −47.7%, and 1 more at this point: KSLV −45.5%TLTX −38.0%TLTP −37.8%FDND −34.2%TLTW −31.3%, and 1 more at this point: LQTI −27.1%OARK −17.0%GDXY −16.4%HISF −16.0%TQQY −12.0%, and 2 more at this point: MAGY −10.0%, GDXW −7.1%BNDI 1.6%GIAX 5.3%OVB 6.3%XLYI 9.8%, and 4 more at this point: SLJY 10.2%, QUSA 10.3%, CEPI 13.6%, ACKY 13.9%LQDW 15.2%, and 1 more at this point: IWMY 16.4%XLRI 20.0%XLCI 20.9%, and 1 more at this point: YQQQ 20.9%HYTI 23.2%, and 5 more at this point: QLDY 23.4%, YSPY 24.7%, QRMI 25.9%, DRKY 26.4%, QDTY 28.0%KQQQ 30.7%, and 2 more at this point: HYGW 31.4%, HYBI 31.8%QDTE 34.5%, and 1 more at this point: GPTY 36.0%XLUI 34.5%OVT 38.7%, and 3 more at this point: RDTE 40.9%, QQQY 43.1%, WDTE 43.5%ACEI 43.9%, and 4 more at this point: OVM 44.6%, RDTY 44.6%, XDTE 45.8%, SDTY 46.9%XLKI 48.1%BIGY 50.8%XLFI 56.2%, and 2 more at this point: XPAY 56.9%, YFYA 56.9%QQQI 57.6%, and 1 more at this point: IWMW 60.8%XRMI 65.3%TDAQ 67.3%, and 1 more at this point: JUCY 67.5%WEEL 71.2%CAIE 71.4%, and 5 more at this point: WTPI 71.4%, FTHI 71.9%, IVVW 72.4%, JEPQ 74.6%, OMAH 75.7%TSPY 79.9%, and 1 more at this point: QYLG 80.1%XLII 80.9%JULH 85.4%JULJ 85.7%, and 5 more at this point: CSHI 90.4%, XLBI 90.8%, TCAL 91.2%, XIJN 91.3%, CHPY 91.7%LJUL 94.2%FGSI 95.2%, and 3 more at this point: LOCT 98.1%, OCTJ 98.1%, LAPR 98.4%APRJ 100.0%, and 15 more at this point: OCTH 100.0%, SPYI 100.0%, MLPD 100.7%, OVF 100.8%, APRH 101.6%, XISE 101.6%, IQQQ 102.9%, XYLG 103.2%, RYLD 103.3%, NIHI 103.8%, JANJ 104.0%, JANH 104.8%, XIDE 104.8%, LJAN 106.1%, IWMI 106.7%KHPI 100.0%XIMR 108.6%GPIQ 109.3%USOY 113.2%SCLZ 116.7%, and 3 more at this point: XLSI 117.9%, OEI 119.8%, JEPI 121.2%SPIN 123.5%QYLD 126.2%FTQI 126.7%, and 5 more at this point: DJIA 127.0%, PBP 127.4%, RYLG 127.4%, DYLG 128.6%, SPUT 129.2%FTKI 130.0%XYLD 136.8%OVL 139.8%XLVI 142.2%IDVO 146.2%, and 3 more at this point: NBOS 146.5%, BUYW 149.2%, GPIX 149.4%SRHR 151.5%ISPY 153.2%, and 1 more at this point: CVRD 153.9%SDVD 155.3%DIVO 160.6%HCOW 168.7%XLEI 172.8%SEPI 173.9%BALI 178.3%, and 1 more at this point: TYLG 180.4%OVS 189.1%MDST 191.3%YLDE 193.5%KNG 194.2%, and 1 more at this point: ITWO 200.0%RDVI 202.2%TDVI 218.1%DOGG 219.4%PAPI 231.3%WEEI 247.2%EIPI 262.7%SOXY 283.9%IDUB 285.2%VEGA 461.5%DUBS 660.9%SIXH 1,025.0%JOYT 1,512.5%OVLH 1,800.0%QXQ 80.1%QXQ 80.1%−323.2%1,800.0%
−323.2% to 1,800.0% across 171

That is the share of the 171 income ETFs not writing on a single company sitting at or below QXQ.

One year only, and a ratio of two published numbers: it says nothing about where a distribution came from. Where the fund sits in this set, not a rating. Do not average it with another category's score.

Total return as a share of the cash paid: 80.1% · 52nd pct, −323.2% to 1,800.0% across 171.

Covered the mostOne bar per fund · QXQ in whiteCovered the least

About QXQ

Strategycovered call
BenchmarkNasdaq-100 (QQQ)
How the benchmark is set (ETFIQ)QXQ names the Nasdaq-100 Index (prospectus, Form 497, accession 0001398344-26-000155, filed 2026-01-05); QQQ tracks the same index.
Paysquarterly
Net assets (SEC N-PORT, whole fund, as filed for Aug 31, 2026)$82mReport
Latest payout, annualized (ETFIQ)1.0%
Expense ratio (497 XBRL, Jan 5, 2026)0.98%Report
Cash paid, last 12 months, over today’s price (ETFIQ)15.9%
First tradedJun 14, 2024
Paysquarterly
Typical gap between ex-dates91 days
Typical wait from ex-date to payment2 days
Last paid, per share$0.08 ex Sep 28, 2026
Cash paid in the 12 months to Nov 12, 2026, 4 distributions, ex Dec 23, 2025 to Sep 28, 2026$4.8697
How we measure
Every number is an ETFIQ calculation from exchange prices and cash distributions (Tiingo end-of-day), total return with distributions reinvested. Return of capital is the issuer’s estimate. Method

Questions people ask about QXQ

How much has QXQ paid over the last year?
Over the year to Nov 12, 2026, QXQ paid 15.1% of its starting price in cash distributions, while the price fell 4.7%.
Is QXQ ahead of QQQ?
Over the year to Nov 12, 2026, with every distribution reinvested, QXQ returned +12.1% against +11.3% for Nasdaq-100 (QQQ), so a holder was ahead of it by 0.8 points.
How often does QXQ pay, and how much?
QXQ pays quarterly. The latest distribution annualizes to 1.0% at its price on Nov 12, 2026, which is not a promise; the next one can differ.
When does QXQ next pay a distribution?
QXQ pays quarterly. The last distribution went ex on Sep 28, 2026 at $0.08 a share.
What does QXQ cost?
The prospectus expense ratio is 0.98% a year.
Sources and dates
Prices, QXQ and QQQTiingo end-of-day · Nov 12, 2026
Net assets, $82mSEC N-PORT, whole fund · Aug 31, 2026
DistributionsTiingo end-of-day · 9 payments

Links are sources, not endorsements.

Cite this pageCitation, APA and Markdown

ETFIQ, QXQ, income ETFs, data as of Nov 12, 2026. https://etfiq.com/funds/qxq

The payout bar for QXQ, redrawn every trading night.

Free to use with attribution for data ETFIQ computes; issuer data stays under its owner's terms. The underlying files are at Open data.

Price change plus every distribution reinvested on the day it went ex-dividend. This is what you actually ended up with, and the only fair basis for comparing with an index.
Cash paid
Distributions over the window as a share of what the fund cost at the start. A measure of cash delivered, not of return: a fund can pay a great deal and still lose money.
Total return minus benchmark total return, in percentage points. A fund can pay 12% a year and still be behind by 10 points if its price fell while the index rose.
Return of capital
The issuer’s own estimate, in a Rule 19a-1 notice, of how much of a distribution was your own money returned. An estimate and a tax characterization, not a measure of erosion.
The fund owns the stocks and sells call options on them, collecting premium and giving up gains above the strike. Synthetic covered call funds hold options instead of the stocks. 0DTE funds sell options that expire the same day.
A fund that pays a coupon and can be called away early, on dates set when it launched. If it is called, you get your money back with the coupon and the run ends. If it is not, it runs on to the next date.
The level the underlying has to stay above for you to be repaid in full. A barrier is not a buffer. A buffer takes the first slice of a fall for you; a barrier takes none of it once it breaks, so below it you take the whole fall rather than only the part past it.
Embed this chart

Free to use with the credit link. Paste this where the chart should go; it updates every trading night.
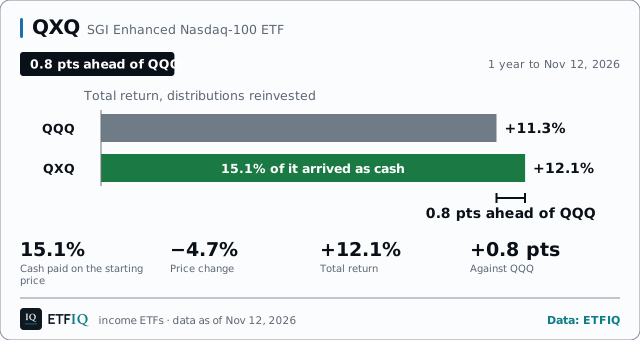
QXQ: QXQ over 1 year: paid 15.1%, price −4.7%, total +12.1%, QQQ +11.3%, +0.8 pts. Data to Nov 12, 2026.
<figure style="margin:0;max-width:640px">
<iframe src="https://etfiq.com/embed/income/qxq/" title="QXQ: QXQ over 1 year: paid 15.1%, price −4.7%, total +12.1%, QQQ +11.3%, +0.8 pts. Data to Nov 12, 2026." width="640" height="370" loading="lazy" style="border:0;max-width:100%;width:100%"></iframe>
<figcaption style="font:13px/1.5 sans-serif">QXQ: QXQ over 1 year: paid 15.1%, price −4.7%, total +12.1%, QQQ +11.3%, +0.8 pts. Data to Nov 12, 2026. Data: <a href="https://etfiq.com/funds/qxq">ETFIQ</a></figcaption>
</figure>

How to embed ETFIQ charts

Get the ETFIQ Daily

The day's ETF flows, a comparison and one number. Every trading morning. About the Daily

The ETFIQ Daily and our other emails. Unsubscribe from any one in a click. See Privacy.

Snapshot, Nov 12, 2026. More on the tabs above.