
FBYY GraniteShares YieldBOOST META ETF

Share ▾
Share on XDownload as PDF
$9.91
+0.5% · 1 day, price
IQ’s readingComputed nightly from ETFIQ data. Not written live.

Over the year to Nov 4, 2026, FBYY paid 27.3% in cash and lost 34.6% in total, against 0.8% for META.

Synthetic covered call on META, paying weeklyGraniteShares ↗Expense ratio 1.17%Fund assets $296,245 on Nov 3, 2026First traded Oct 21, 2025Benchmark Meta Platforms (META)Fund page at the issuer ↗SEC filings ↗Every GraniteShares fund ETFIQ coversDividend history

Promise check: MissedOver the year to Nov 4, 2026, FBYY paid 27.3% in cash and returned −34.6% in total, covering −126.7% of its payout.

FBYY risk and return scorecard

vs META · Oct 2025 to Oct 2026 · 52 weekly returns · dividend-adjusted

Short history · 12 months
FBYY −37.0%, META −4.8%, Oct 2025 to Oct 2026, distributions reinvested.
Return
MeasureFBYYMETAEdge
Total return−37.0%−4.8%META
Annualized−37.0%−4.8%META
Price return−58.2%−5.1%META
Risk
MeasureFBYYMETAEdge
Volatility21.2%43.4%FBYY
Max drawdown−37.0%−26.6%META
Upside capture8.8%100.0%META
Downside capture86.4%100.0%FBYY
Risk-adjusted
MeasureFBYYMETAEdge
Sharpe ratio−2.240.01META
Sortino ratio−2.350.01META
Alpha vs META
MeasureFBYYMETAEdge
Alpha, a year−47.6%META
Alpha t-stat−3.63
Beta to META0.391.00Lower beta

Computed by ETFIQ from Tiingo daily prices and ETFIQ's distribution records; risk-free rate: U.S. Treasury, Daily Treasury Bill Rates, 13-week coupon equivalent Method · Data

Money in and out

Net fund flows · Jun 30, 2026
Since Oct 2025
+$741k

What you earned

FBYY −4.9%, META −15.1%: total return over one month to Nov 4, 2026.
FBYY−4.9%
META−15.1%
Paid 2.2% in cash. Price −7.1%.
FBYY −3.3%, META +7.1%: total return over three months to Nov 4, 2026.
FBYY−3.3%
META+7.1%
Paid 7.2% in cash. Price −10.2%.
FBYY −11.1%, META +3.0%: total return over six months to Nov 4, 2026.
FBYY−11.1%
META+3.0%
Paid 14.1% in cash. Price −24.2%.
FBYY −31.1%, META −4.3%: total return over the year to Nov 4, 2026.
FBYY−31.1%
META−4.3%
Paid 23.2% in cash. Price −50.7%.
FBYY −34.6%, META +0.8%: total return over one year to Nov 4, 2026.
FBYY−34.6%
META+0.8%
Paid 27.3% in cash. Price −56.6%.
FBYY −38.8%, META −13.8%: total return since launch to Nov 4, 2026.
FBYY−38.8%
META−13.8%
Paid 27.0% in cash. Price −60.2%.

What it paid

13 distributions · latest Oct 30, 2026
27.3%
Cash paid, 1 year, on its starting price
−34.6%
Total return, 1 year
−35.4 pts
Against META
83.9%
Return of capital, latest payout (GraniteShares estimate)
$0.057
Last payment (paid weekly), ex-date Oct 30, 2026
Pays weekly.

More on FBYY

Every number below is on this page. Open what you need.

The week's ETF fund flows, by email on Sundays.

One-click unsubscribe. See Privacy.

Price and total return, 1 year

$9.91+0.5%1 day, priceClose, Nov 4, 2026

Total return adds every distribution, reinvested. Computed by ETFIQ from Tiingo daily prices.

Source: Tiingo end-of-day prices. Data as of Nov 4, 2026. Updated every trading night. Report a data error

FBYY returns by window: total return, cash paid and price change
WindowTotal returnCash paidPriceMETAAhead or behind
1M Oct 5 – Nov 4, 2026−4.9%2.2%−7.1%−15.1%+10.2 pts
3M Aug 5 – Nov 4, 2026−3.3%7.2%−10.2%+7.1%−10.4 pts
6M May 6 – Nov 4, 2026−11.1%14.1%−24.2%+3.0%−14.1 pts
YTD Dec 31, 2025 – Nov 4, 2026−31.1%23.2%−50.7%−4.3%−26.8 pts
1Y Nov 4, 2025 – Nov 4, 2026−34.6%27.3%−56.6%+0.8%−35.4 pts
Since launch Oct 21, 2025 – Nov 4, 2026−38.8%27.0%−60.2%−13.8%−25.0 pts
Since launch, annualised Oct 21, 2025 – Nov 4, 2026−37.7%––––

Total returns, distributions reinvested. Listed Oct 2025: no 3 years windows.

Source: Tiingo end-of-day prices, with distributions reinvested.

Where the return came from
Price change −7.1%Cash paid +2.2%, reinvested+10.2 pts vs META

46.2%

Price change −10.2%Cash paid +7.2%, reinvested−10.4 pts vs META

0.0%

Price change −24.2%Cash paid +14.1%, reinvested−14.1 pts vs META

0.0%

Price change −56.6%Cash paid +27.3%, reinvested−35.4 pts vs META

0.0%

Price change −60.2%Cash paid +27.0%, reinvested−25.0 pts vs META

0.0%

14.9
IQ Income ScoreETFIQ Distribution Coverage Score66th of 77 · Nov 4, 2026
0.6 · lowest of 77 income ETFs writing on a single company99.4 · highest

How much of its payouts the fund's total return covered, ranked against 77 income ETFs writing on a single company. 100 is best. How it is computed

FBYY paid 27.3% in cash over the year while its total return was −34.6%, so it paid out more than it returned.

total return as a share of the cash paid−126.7% · 15th pct

Money in and out

Monthly data · as of Jun 30, 2026

FBYY: in the month to Jun 30, 2026, nothing net moved, by its SEC filing.

Since Oct 2025
+$741k
Oct 1, 2025 to Jun 30, 2026
monthly, from SEC filings

Computed by ETFIQ from the monthly sales and redemptions FBYY files with the SEC on Form N-PORT.

How this is computed

ETFIQ reads no daily data for this fund, so its flows are monthly, and the latest month filed is Jun 2026. Every day and month ETFIQ holds for FBYY, back to Oct 2025, is in its flows file. Flows across every fund · How these flows are computed · Compare FBYY with other funds in the flows tool

Month by month, money in and money outOct 2025 to Jun 2026

FBYY, money in and money out each month from Oct 2025 to Jun 2026: two bars a month, money in above the line and money out below. Every bar is from FBYY’s SEC filings (N-PORT item B.6). Of the 9 months listed, money came in on net in 2 and went out in 1.

Every bar is from FBYY’s SEC filings (N-PORT item B.6). Of the 9 months listed, money came in on net in 2 and went out in 1.

MonthInOutNet
Jun 2026 SEC Form N-PORT$0$0$0
May 2026 SEC Form N-PORT$0$0$0
Apr 2026 SEC Form N-PORT$0$0$0
Mar 2026 SEC Form N-PORT$0$0$0
Feb 2026 SEC Form N-PORT$0$0$0
Jan 2026 SEC Form N-PORT$0$0$0
Dec 2025 SEC Form N-PORT+$198k$0+$198k
Nov 2025 SEC Form N-PORT$0−$207k−$207k
Oct 2025 SEC Form N-PORT+$750k$0+$750k

Most recent first.

How this is computed

N-PORT months: money in is sales plus reinvestments; money out is redemptions.

N-PORT months are the filed sales plus reinvestments less redemptions. Later months add up the daily data; the Source column names any missing day.

Source: ETFIQ, from the fund’s SEC N-PORT filings. Data as of Jun 30, 2026. Updated when the fund files its next report.

FBYY key stats

52-week high, daily closes to Nov 4, 2026 (ETFIQ)$23.23 on Nov 5, 2025
52-week low, daily closes to Nov 4, 2026 (ETFIQ)$9.80 on Nov 2, 2026
Close on Nov 4, 2026, within that range (ETFIQ)$9.91, 1% of the way from the low to the high
Range, beta and R-squared computed by ETFIQ from Tiingo daily prices.

FBYY return of capital and tax

Return of capital, latest notice (GraniteShares estimate, Sep 22, 2026)83.9%
Return of capital, distributions paid Dec 2, 2025 to Sep 22, 2026 (GraniteShares estimates)97.2%
Notices behind that number37 of 52 distributions
Return of capital, fiscal year to Jun 30, 2026 (annual report, filed Sep 4, 2026)97.4%
Options it writes (holdings as of Jun 30, 2026)Options on ETF shares, which are not Section 1256 contracts
Estimates are GraniteShares’s Rule 19a-1 notices, made before the fund year closes. The fiscal year number is the annual report’s tax character. Not tax advice. What a 19a-1 estimate is · Income ETFs by return of capital

Trading

as of Nov 4, 2026
Trading · FBYYas of Nov 4, 2026
·
Not scored2 of 6 measured · Nov 4, 2026
0 · Hard to tradeIQ Liquidity Score100 · Trades like a giant
Cost for your order · one way, half its 30-day median spread
Premium or discount to NAV, Nov 3 close−0.10%
−0.3%95% of days within ±0.18% · the 1% band is off this scale+0.3%
One dealer
How to tradeSpread not read.
Full trading page: components, premium history, dealers →

FBYY for holders outside the US

US tax withheld on dividends, no treaty30%
Treaty rates on dividends (IRS table, read Oct 30, 2026)65 countries, 10% to 30%
FBYY interest-related and short-term gain dividendsnot read by ETFIQ
US estate tax filing threshold, non-resident holders$60,000
Share classDistributing

FBYY is a US fund. Stock of US corporations counts as US property for a non-resident's estate. Facts from the IRS, not tax advice. How withholding and treaties work
Aug 2026Weekly, per shareOct 2026

13 distributions for FBYY, $0.057 to $0.064 a share and $0.0612 in the middle, Aug 7, 2026 to Oct 30, 2026. 6 further ex-dates are expected with no amount the issuer has declared, so they are not drawn.

Latest
$0.057
Ex Oct 30, 2026 · paid about 4 days later
Annualized
29.9%
At its price on Nov 4, 2026
Trailing 12 months
63.0%
52 payments, ex Nov 7, 2025 to Oct 30, 2026: $6.2474
Return of capital
83.9%
Latest payout (GraniteShares estimate)
Next, projected

FBYY pays weekly. The last distribution was $0.057 a share, which went ex on Oct 30, 2026, with payment about 4 days later. The next has not been declared. On its own cadence of about 7 days the ex-date falls near Nov 6, 2026; that date is an ETFIQ projection, not the issuer’s.

Nov 6, 2026 · pay Nov 10, 2026$0.057 ETFIQ projection
Nov 13, 2026 · pay Nov 17, 2026$0.057 ETFIQ projection
Nov 20, 2026 · pay Nov 24, 2026$0.057 ETFIQ projection
Nov 27, 2026 · pay Dec 1, 2026$0.057 ETFIQ projection
Dec 4, 2026 · pay Dec 8, 2026$0.057 ETFIQ projection
Dec 11, 2026 · pay Dec 15, 2026$0.057 ETFIQ projection

Expected distributions for FBYY. A projected row carries the fund’s own spacing forward from its last ex-date, at the last amount paid. Neither is an issuer statement. Source: ETFIQ.

Every distribution ETFIQ holds for FBYY (13, most recent first)
Oct 30, 2026$0.057
Oct 23, 2026$0.06
Oct 16, 2026$0.0604
Oct 9, 2026$0.0625
Oct 2, 2026$0.06
Sep 25, 2026$0.064
Sep 18, 2026$0.0612
Sep 11, 2026$0.0605
Sep 4, 2026$0.0613
Aug 28, 2026$0.0622
Aug 21, 2026$0.0593
Aug 14, 2026$0.0612
Aug 7, 2026$0.0617

Cash distributions per share for FBYY. Source: ETFIQ from Tiingo end-of-day distributions.

Source: ETFIQ, from Tiingo end-of-day distributions.

How much of what it paid out did its total return cover?

Total return as a share of the cash paid
NFLP −365.9%COIW −213.3%NFLW −204.8%MSTW −201.8%RBLY −182.8%MARO −166.3%BABW −165.8%MTYY −160.1%HOOW −148.9%UBEW −141.2%NFLY −134.2%CONY −125.6%COYY −122.8%HOYY −112.0%MAAY −108.6%AIYY −105.8%MSTY −100.0%TSLP −97.5%SMCY −94.3%BABO −93.8%RDYY −89.7%HOOY −83.2%HIYY −76.2%PLYY −73.5%IOYY −71.7%TSLW −63.7%PLTW −61.6%SMYY −60.8%DRAY −58.9%, and 1 more at this point: BBYY −58.8%CRCO −55.5%TSYY −50.3%TSII −43.9%GOOP −41.1%PYPY −39.1%AVGW −36.6%AZYY −31.8%NVYY −27.7%GMEY −25.1%TSLY −25.1%PLTY −17.9%FBY −17.0%METW −14.6%NVDW −12.6%DIPS −2.7%GOOW −1.1%MSFY 0.7%WNTR 3.2%AMZP 4.5%GOOY 7.3%NVII 8.9%AMZW 9.2%NVDY 13.2%ARMW 13.5%AMYY 16.5%CRSH 16.5%AMZY 19.2%MSFW 24.1%SNOY 29.6%XYZY 30.0%MSFO 31.2%COSW 43.8%CVNY 47.1%JPO 52.2%WMTI 57.0%FIAT 58.5%TSMY 64.8%APLY 75.4%BRKC 76.6%XOMO 84.1%AMDY 102.6%BRKW 112.9%AAPW 118.1%AMDW 146.3%AAPY 252.0%MRNY 498.6%FBYY −126.7%FBYY −126.7%−365.9%498.6%
−365.9% to 498.6% across 77

That is the share of the 77 income ETFs writing on a single company sitting at or below FBYY.

One year only, and a ratio of two published numbers: it says nothing about where a distribution came from. Where the fund sits in this set, not a rating. Do not average it with another category's score.

Total return as a share of the cash paid: −126.7% · 15th pct, −365.9% to 498.6% across 77.

Covered the mostOne bar per fund · FBYY in whiteCovered the least

About FBYY

Strategysynthetic covered call
BenchmarkMeta Platforms (META)
How the benchmark is set (ETFIQ)Its prospectus names META as the company its options are written on (prospectus, Form 497K, accession 0001493152-25-019673, filed 2025-10-27, principal investment strategies).
Paysweekly
Net assets (issuer page, as of Nov 3, 2026)$296,245Report
Latest payout, annualized (ETFIQ)29.9%
Expense ratio (497 XBRL, Oct 28, 2026)1.17%Report
Cash paid, last 12 months, over today’s price (ETFIQ)63.0%
First tradedOct 21, 2025
Return of capital, latest distribution (GraniteShares 19a-1 estimate)83.9%
Paysweekly
Typical gap between ex-dates7 days
Typical wait from ex-date to payment4 days
Last paid, per share$0.057 ex Oct 30, 2026
Cash paid in the 12 months to Nov 4, 2026, 52 distributions, ex Nov 7, 2025 to Oct 30, 2026$6.2474
How we measure
Every number is an ETFIQ calculation from exchange prices and cash distributions (Tiingo end-of-day), total return with distributions reinvested. Return of capital is the issuer’s estimate. Method
IQ Investment Committee on FBYY

12 seats on FBYY, as of Nov 4, 2026: 6 Challenges, 6 Not enough data.

In the tradition ofJohn BogleBogle-style Low CostChallenges
In the tradition ofBenjamin GrahamGraham-style Margin of SafetyNot enough data
In the tradition ofWarren Buffett & Charlie MungerBuffett & Munger-style QualityNot enough data
In the tradition ofPeter LynchLynch-style Growth at a Reasonable PriceNot enough data
In the tradition ofJohn TempletonTempleton-style Global ContrarianNot enough data
In the tradition ofRay DalioDalio-style All-WeatherNot enough data
In the tradition ofHoward MarksMarks-style Cycles & RiskNot enough data
In the tradition ofStanley DruckenmillerDruckenmiller-style Macro & LiquidityChallenges
In the tradition ofDavid SwensenSwensen-style DiversificationChallenges
In the tradition ofCathie WoodWood-style Disruptive InnovationChallenges
In the tradition ofJesse LivermoreLivermore-style Trend FollowingChallenges
Uses ETFIQ’s measuresThe ETFIQ SkepticETFIQ’s own seatChallenges
Put FBYY to the committee →See all seats →No investor named is affiliated with or endorses ETFIQ. Not investment advice.

Questions people ask about FBYY

How much has FBYY paid over the last year?
Over the year to Nov 4, 2026, FBYY paid 27.3% of its starting price in cash distributions, while the price fell 56.6%.
Is FBYY ahead of META?
Over the year to Nov 4, 2026, with every distribution reinvested, FBYY returned −34.6% against +0.8% for Meta Platforms (META), so a holder was behind it by 35.4 points.
How often does FBYY pay, and how much?
FBYY pays weekly. The latest distribution annualizes to 29.9% at its price on Nov 4, 2026, which is not a promise; the next one can differ.
Is the FBYY distribution return of capital?
GraniteShares estimates 84% of the distribution paid Sep 22, 2026 was return of capital. That is a tax characterization from the fund's own 19a-1 notice, not a measure of erosion.
When does FBYY next pay a distribution?
FBYY pays weekly. The last distribution went ex on Oct 30, 2026 at $0.057 a share. The next is not declared; on a cadence of about 7 days the ex-date falls near Nov 6, 2026, which is an ETFIQ projection. Payment usually follows the ex-date by 4 days.
What does FBYY cost?
The prospectus expense ratio is 1.17% a year.
How much of FBYY’s distribution is return of capital?
GraniteShares’s Rule 19a-1 notice estimates 83.9% of the distribution paid Sep 22, 2026 was return of capital. Across its notices for distributions paid Dec 2, 2025 to Sep 22, 2026, the estimate is 97.2%. The annual report for the fiscal year to Jun 30, 2026 puts it at 97.4% of distributions. Estimates come before the fund year closes and often change.
Sources and dates
Prices, FBYY and METATiingo end-of-day · Nov 4, 2026
Net assets, $296,245Issuer page · Nov 3, 2026
DistributionsTiingo end-of-day · 13 payments

Links are sources, not endorsements.

Cite this pageCitation, APA and Markdown

ETFIQ, FBYY, income ETFs, data as of Nov 4, 2026. https://etfiq.com/funds/fbyy

The payout bar for FBYY, redrawn every trading night.

Free to use with attribution for data ETFIQ computes; issuer data stays under its owner's terms. The underlying files are at Open data.

Price change plus every distribution reinvested on the day it went ex-dividend. This is what you actually ended up with, and the only fair basis for comparing with an index.
Cash paid
Distributions over the window as a share of what the fund cost at the start. A measure of cash delivered, not of return: a fund can pay a great deal and still lose money.
Total return minus benchmark total return, in percentage points. A fund can pay 12% a year and still be behind by 10 points if its price fell while the index rose.
Return of capital
The issuer’s own estimate, in a Rule 19a-1 notice, of how much of a distribution was your own money returned. An estimate and a tax characterization, not a measure of erosion.
The fund owns the stocks and sells call options on them, collecting premium and giving up gains above the strike. Synthetic covered call funds hold options instead of the stocks. 0DTE funds sell options that expire the same day.
A fund that pays a coupon and can be called away early, on dates set when it launched. If it is called, you get your money back with the coupon and the run ends. If it is not, it runs on to the next date.
The level the underlying has to stay above for you to be repaid in full. A barrier is not a buffer. A buffer takes the first slice of a fall for you; a barrier takes none of it once it breaks, so below it you take the whole fall rather than only the part past it.
Embed this chart

Free to use with the credit link. Paste this where the chart should go; it updates every trading night.
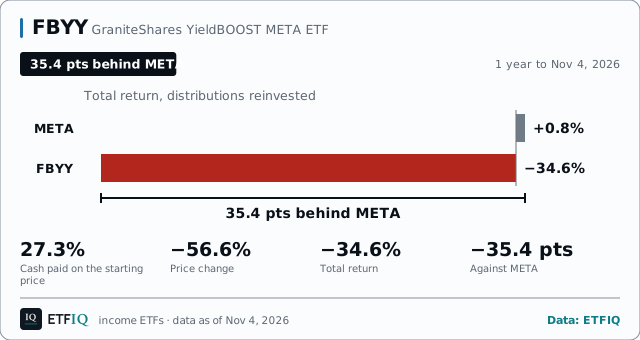
FBYY: FBYY over 1 year: paid 27.3%, price −56.6%, total −34.6%, META +0.8%, −35.4 pts. Data to Nov 4, 2026.
<figure style="margin:0;max-width:640px">
<iframe src="https://etfiq.com/embed/income/fbyy/" title="FBYY: FBYY over 1 year: paid 27.3%, price −56.6%, total −34.6%, META +0.8%, −35.4 pts. Data to Nov 4, 2026." width="640" height="370" loading="lazy" style="border:0;max-width:100%;width:100%"></iframe>
<figcaption style="font:13px/1.5 sans-serif">FBYY: FBYY over 1 year: paid 27.3%, price −56.6%, total −34.6%, META +0.8%, −35.4 pts. Data to Nov 4, 2026. Data: <a href="https://etfiq.com/funds/fbyy">ETFIQ</a></figcaption>
</figure>

How to embed ETFIQ charts

Get the ETFIQ Daily

The day's ETF flows, a comparison and one number. Every trading morning. About the Daily

The ETFIQ Daily and our other emails. Unsubscribe from any one in a click. See Privacy.

Snapshot, Nov 4, 2026. More on the tabs above.