CEPI REX Crypto Equity Premium Income ETF
Covered call on BITQ, paying weekly
Over the year to Sep 18, 2026, CEPI paid 35.3% in cash and finished 6.0 points ahead of BITQ.
Key facts
ETFIQ Return Stability Score
55.2joint 70th of 173
CEPI paid 35.3% in cash. Its price fell 22.5%, so 64% of what you were paid came back out of your own capital.
Was the payout funded by returns, or by your own capital?
96.2% of the 173 sit at or below CEPI on this measure.
14.2% of the 173 sit at or below CEPI on this measure.
Weighted evenly, those two positions are what the score combines, across the 173 income ETFs writing on an index or proxy. Neither spread above is the score: a fund can sit further right on one and score lower. A position in this set, not a rating: it moves when the set moves, and it is not a figure to average against another desk's.
| What it measures | This fund | Its percentile | Weight |
|---|---|---|---|
| against its benchmark | +6.0 pts | 96.2 | 50% |
| what happened to the principal | −22.5% | 14.2 | 50% |
What a holder got
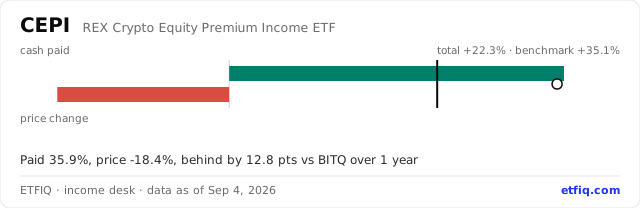
Over the year to Sep 18, 2026, CEPI returned +18.1% with distributions reinvested and Crypto industry (BITQ), used as the crypto proxy returned +12.1%, so a holder came out ahead of it by 6.0 points. The lighter segment is the 35.3% that arrived as cash rather than as price.
Its ten largest equity positions
| Holding | Ticker | Weight | |
|---|---|---|---|
| Advanced Micro Devices Inc | AMD | 6.59% | |
| Micron Technology Inc | MU | 5.71% | |
| Applied Digital Corp | APLD | 5.64% | |
| Strategy Inc | MSTR | 5.58% | |
| MARA Holdings Inc | MARA | 5.57% | |
| IREN Ltd | IREN | 5.29% | |
| TSMC | TSM | 4.72% | |
| NVIDIA Corp | NVDA | 4.55% | |
| Visa Inc | V | 4.43% | |
| Coinbase Global Inc | COIN | 4.43% |
Period by period
| Window | Cash paid | Price | Total return | BITQ | Ahead or behind |
|---|---|---|---|---|---|
| 3 months | 9.6% | −9.2% | +0.9% | −2.1% | +3.1 pts |
| 6 months | 22.2% | +4.9% | +29.4% | +33.8% | −4.4 pts |
| 1 year | 35.3% | −22.5% | +18.1% | +12.1% | +6.0 pts |
| Since launch | 51.2% | −37.7% | +26.2% | +27.2% | −1.0 pts |
When CEPI pays
CEPI pays weekly. The last distribution was $0.2513 a share, which went ex on Sep 16, 2026 and was paid on Sep 17, 2026. The next is declared: $0 going ex on Dec 30, 2026, payable Dec 31, 2026.
| Ex-date | Pay date | Amount | Basis |
|---|---|---|---|
| Dec 30, 2026 | Dec 31, 2026 | $0 | Declared by the issuer |
Every distribution ETFIQ holds for CEPI (13, most recent first)
| Ex-date | Amount |
|---|---|
| Sep 16, 2026 | $0.2513 |
| Sep 9, 2026 | $0.2567 |
| Sep 2, 2026 | $0.2515 |
| Aug 26, 2026 | $0.2522 |
| Aug 19, 2026 | $0.2578 |
| Aug 12, 2026 | $0.2493 |
| Aug 5, 2026 | $0.2554 |
| Jul 29, 2026 | $0.2542 |
| Jul 22, 2026 | $0.2566 |
| Jul 15, 2026 | $0.2589 |
| Jul 8, 2026 | $0.2686 |
| Jul 1, 2026 | $0.2729 |
| Jun 24, 2026 | $0.284 |
Every income ETF going ex-dividend in the next fortnight
In plain words
Since it launched on Dec 4, 2024, CEPI has returned +26.2% with distributions reinvested, against +27.2% for Crypto industry (BITQ), used as the crypto proxy, and has paid out 51.2% of its starting value in cash along the way. It pays weekly, and at its current price the latest distribution annualizes to 41.0%. REX estimates that 100% of the distribution paid Aug 27, 2026 was a return of capital. That is the issuer’s own Rule 19a-1 estimate and a tax characterization, made before the fund year closes: it says the payment included money the fund gave back rather than earned, not that the fund is eroding.
| Strategy | covered call |
|---|---|
| Benchmark | Crypto industry (BITQ), used as the crypto proxy (proxy) |
| Pays | weekly |
| Net assets (issuer page, as of Sep 17, 2026) | $121m |
| Latest payout, annualized (ETFIQ) | 41.0% |
| Expense ratio (485BPOS XBRL, Feb 27, 2026) | 0.85% |
| Cash paid, last 12 months, over today’s price (ETFIQ) | 45.5% |
| Launched | Dec 4, 2024 |
| Return of capital, latest distribution (REX 19a-1 estimate) | 100.0% |
| Pays | weekly |
| Typical gap between ex-dates | 7 days |
| Typical wait from ex-date to payment | 1 day |
| Last paid, per share | $0.2513 ex Sep 16, 2026 |
| Sum of the last 12 distributions | $3.0853 |
Every figure is an ETFIQ calculation from exchange prices and cash distributions (Tiingo end-of-day), total return with distributions reinvested. Return of capital is the issuer’s estimate. How these figures are computed
Questions people ask
- How much has CEPI paid over the last year?
- Over the year to Sep 18, 2026, CEPI paid 35.3% of its starting price in cash distributions, while the price fell 22.5%.
- Is CEPI ahead of BITQ?
- Over the year to Sep 18, 2026, with every distribution reinvested, CEPI returned +18.1% against +12.1% for Crypto industry (BITQ), used as the crypto proxy, so a holder was ahead of it by 6.0 points.
- How often does CEPI pay, and how much?
- CEPI pays weekly. The latest distribution annualizes to 41.0% at its price on Sep 18, 2026, which is not a promise; the next one can differ.
- Is the CEPI distribution return of capital?
- REX estimates 100% of the distribution paid Aug 27, 2026 was return of capital. That is a tax characterization from the fund's own 19a-1 notice, not a measure of erosion.
- When does CEPI next pay a distribution?
- CEPI pays weekly. The last distribution went ex on Sep 16, 2026 at $0.2513 a share. The next is declared: $0, ex Dec 30, 2026, payable Dec 31, 2026.
- What does CEPI cost?
- The prospectus expense ratio is 0.85% a year.
The words on this page
- Total return
- What a holder actually ended up with: price change plus every distribution, reinvested. The only figure that answers whether you came out ahead.
- Cash paid
- Distributions over the window as a share of what the fund cost at the start. A measure of cash delivered, not of return: a fund can pay a great deal and still lose money.
- Ahead or behind
- The fund’s total return minus the benchmark’s over exactly the same days, in percentage points. Both sides reinvest.
- Return of capital
- The issuer’s own estimate, in a Rule 19a-1 notice, of how much of a distribution was your own money returned. An estimate and a tax characterization, not a measure of erosion.
- Covered call
- Selling call options on shares the fund holds. It collects a premium and gives up the gains above the strike, which is why these funds pay well and lag a rising market.
Every term used here, defined in full on the income ETFs vocabulary page.
Where these figures came from
ETFIQ links to the documents behind every figure. It is not affiliated with any issuer, and a link is not an endorsement.
Compare CEPI
Also against BLOX, BPI, BTCC, BTCI, DFII, EHCC, EHY, ETCO, ETTY, LFGY, NEHI, SOLM, XBCI, XBTY, XEY, XRPM, YBIT, YBTC, YETH.
Funds near this one
Put this on your own page
The payout bar for CEPI, redrawn every trading night. Free to use with the credit link.
Where CEPI is written about
Use this data, or open the live card
Open CEPI live on ETFIQ, where the figures refresh with the data.
Cite this page. ETFIQ, CEPI, income ETFs, data as of Sep 18, 2026. https://etfiq.com/funds/cepi Free to use with attribution; the underlying files are at Open data.