

QBUL TrueShares Quarterly Bull Hedge ETF
Share ▾
Over the year to Nov 4, 2026, QBUL returned 0.4%, against 14.8% for VOO.
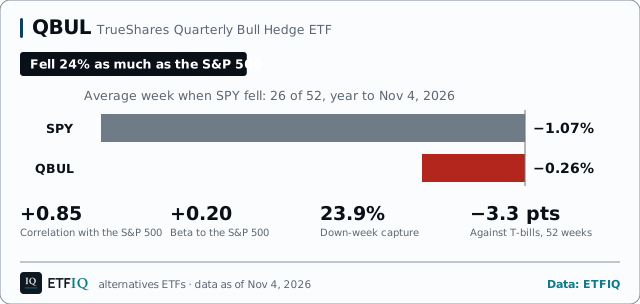
Promise check: DeliveredIn the 52 weeks to Nov 4, 2026, QBUL moved 23.9% as much as the S&P 500 in the 26 weeks it fell.
QBUL risk and return scorecard
vs VOO · Jul 2024 to Oct 2026 · 120 weekly returns · dividend-adjusted
Computed by ETFIQ from Tiingo daily prices and ETFIQ's distribution records; risk-free rate: U.S. Treasury, Daily Treasury Bill Rates, 13-week coupon equivalent Method · Data
Money in and out
Net fund flows · Jul 31, 2026What you earned
How concentrated, and what does it cost?
More on QBUL
Every number below is on this page. Open what you need.Price and total return, 1 year
$24.04+0.2%1 day, priceClose, Nov 4, 2026
Total return adds every distribution, reinvested. Computed by ETFIQ from Tiingo daily prices.
Source: Tiingo end-of-day prices. Data as of Nov 4, 2026. Updated every trading night. Report a data error
| Window | Total return | Benchmark (VOO) | Gap to VOO |
|---|---|---|---|
| 1M Oct 5 – Nov 4, 2026 | −0.3% | −1.1% | +0.8 pts |
| 3M Aug 5 – Nov 4, 2026 | −0.9% | −0.1% | −0.8 pts |
| 6M May 6 – Nov 4, 2026 | −0.8% | +5.0% | −5.8 pts |
| YTD Dec 31, 2025 – Nov 4, 2026 | +1.0% | +13.4% | −12.4 pts |
| 1Y Nov 4, 2025 – Nov 4, 2026 | +0.4% | +14.8% | −14.4 pts |
| Since launch Jul 1, 2024 – Nov 4, 2026 | +6.5% | +44.5% | −38.0 pts |
| Since launch, annualised Jul 1, 2024 – Nov 4, 2026 | +2.7% | – | – |
Total returns, distributions reinvested. Listed Jul 2024: no 3 years windows.
Source: Tiingo end-of-day prices, with distributions reinvested.
QBUL in the 26 weeks SPY fell, year to Nov 4, 2026: SPY averaged −1.07%, QBUL −0.26%.
How much it diversifies a stock portfolio, ranked against 22 equity hedged alternatives ETFs with a full year. 100 is best. How it is computed
QBUL’s weekly returns had a correlation of +0.85 with the S&P 500, and in the weeks the index fell its down-week capture was 23.9%. Over the same 52 weeks it finished 3.3 points behind T-bills.
Money in and out
Monthly data · as of Jul 31, 2026QBUL: in the month to Jul 31, 2026, net $8.0m came in, by its SEC filing.
Aug 1, 2025 to Jul 31, 2026
monthly, from SEC filings
monthly, from SEC filings
Computed by ETFIQ from the monthly sales and redemptions QBUL files with the SEC on Form N-PORT.
How this is computed
ETFIQ reads no daily data for this fund, so its flows are monthly, and the latest month filed is Jul 2026. Every day and month ETFIQ holds for QBUL, back to May 2024, is in its flows file. Flows across every fund · How these flows are computed · Compare QBUL with other funds in the flows tool
Month by month, money in and money outMay 2024 to Jul 2026
QBUL, money in and money out each month from May 2024 to Jul 2026: two bars a month, money in above the line and money out below. Every bar is from QBUL’s SEC filings (N-PORT item B.6). Of the 27 months listed, money came in on net in 19 and went out in 5.
Every bar is from QBUL’s SEC filings (N-PORT item B.6). Of the 27 months listed, money came in on net in 19 and went out in 5.
Most recent first.
How this is computed
N-PORT months: money in is sales plus reinvestments; money out is redemptions.
N-PORT months are the filed sales plus reinvestments less redemptions. Later months add up the daily data; the Source column names any missing day.
Source: ETFIQ, from the fund’s SEC N-PORT filings. Data as of Jul 31, 2026. Updated when the fund files its next report.
QBUL key stats
Trading
as of Jan 13, 2026
QBUL for holders outside the US
How much does it diversify a stock portfolio?
70.5% of the 22 sit at or above QBUL on this measure.
65.9% of the 22 sit at or above QBUL on this measure.
Weighted evenly, those two positions are what the score combines, across the 22 equity hedged alternatives ETFs with a full year. Neither spread above is the score: a fund can sit further right on one and score lower.
One year of weekly moves against the S&P 500, within one strategy; it ignores what the fund returned. Where the fund sits in this set, not a rating. Do not average it with another category's score.
| What it measures | This fund | Its percentile | Weight |
|---|---|---|---|
| correlation with the S&P 500 | +0.85 | 70.5 | 50% |
| down-week capture against the S&P 500 | 23.9% | 65.9 | 50% |
About QBUL
12 seats on QBUL, as of Nov 4, 2026: 2 Mixed, 2 Challenges, 7 Not enough data, 1 Does not apply.
Questions people ask about QBUL
- Does QBUL move with the S&P 500?
- Over the year to Nov 4, 2026, QBUL’s weekly returns had a correlation of +0.85 with the S&P 500’s, on a scale where 1 moves in step, 0 shows no pattern and −1 moves opposite. Its beta was +0.20, so for each 1% the index moved it moved about 0.20% the same way.
- What did QBUL do when stocks fell?
- The S&P 500 fell in 26 of the 52 weeks to Nov 4, 2026, by 1.07% on average. In those weeks QBUL fell 0.26% on average, a down-week capture of 23.9%.
- Did QBUL earn more than cash?
- Over the same 52 weeks QBUL returned +0.3% with distributions reinvested, and BIL, a fund of Treasury bills, returned +3.7%. QBUL finished 3.3 percentage points behind it.
- What does QBUL cost?
- The prospectus expense ratio is 0.79% a year.
- Why is QBUL listed as hedged equity?
- ETFIQ files each fund by what its own prospectus says it does, and QBUL’s, filed Feb 27, 2026, describes a hedged equity fund.
Links are sources, not endorsements.
Cite this pageCitation, APA and Markdown
ETFIQ, QBUL, alternatives ETFs, data as of Nov 4, 2026. https://etfiq.com/funds/qbul
ETFIQ. (Nov 4, 2026). QBUL, alternatives ETFs. Retrieved from https://etfiq.com/funds/qbul
[QBUL, alternatives ETFs (ETFIQ, Nov 4, 2026)](https://etfiq.com/funds/qbul)
The down-week bars for QBUL, redrawn every trading night.
Free to use with attribution for data ETFIQ computes; issuer data stays under its owner's terms. The underlying files are at Open data.
Embed this chart
Free to use with the credit link. Paste this where the chart should go; it updates every trading night.
<figure style="margin:0;max-width:640px">
<iframe src="https://etfiq.com/embed/alternatives/qbul/" title="QBUL: QBUL in the 26 weeks SPY fell, year to Nov 4, 2026: SPY averaged −1.07%, QBUL −0.26%." width="640" height="334" loading="lazy" style="border:0;max-width:100%;width:100%"></iframe>
<figcaption style="font:13px/1.5 sans-serif">QBUL: QBUL in the 26 weeks SPY fell, year to Nov 4, 2026: SPY averaged −1.07%, QBUL −0.26%. Data: <a href="https://etfiq.com/funds/qbul">ETFIQ</a></figcaption>
</figure>The day's ETF flows, a comparison and one number. Every trading morning. About the Daily
Snapshot, Nov 4, 2026. More on the tabs above.