
THLV · THOR Equal Weight Low Volatility ETF

$31.58
−0.5% · 1 day, price
Fact sheet
Share ▾
Share on XDownload as PDF
Embed ▾

Free to use with the credit link. It updates every trading night.

Fund card

<iframe src="https://etfiq.com/embed/fund/thlv/" title="ETFIQ THLV analysis" width="100%" height="420" loading="lazy" style="border:0;max-width:600px"></iframe>
<p>Data: <a href="https://etfiq.com/funds/thlv">ETFIQ THLV analysis</a></p>

How to embed ETFIQ charts

THLV tracks an index and returned +5.7% over the past year.

1-year total return
+5.7%VOO +12.1% to Nov 12, 2026
Expense ratio
0.64%a year
Equity fund · Tracks the THOR Equal Weight Low Volatility IndexExpense ratio 0.64%Fund assets $56m net assets, latest filing (Aug 31, 2026)First traded Sep 13, 2022Benchmark S&P 500 Index, measured by VOO, which tracks the same indexSEC filings ↗Dividend history

THLV returned +5.7% over the year to Nov 12, 2026, charges 0.64% a year and holds $56m in net assets on Aug 31, 2026.

Promise check: Not measured

Growth of $10,000

THLV vs VOO, 1 year

Total return, distributions reinvested, Nov 11, 2025 to Nov 11, 2026.

THLV $10,630 +6.3%VOO $11,251 +12.5%Returns from daily closes. Data
Scorecard · vs VOO

THLV risk and return scorecard

vs VOO · Sep 2022 to Nov 2026 · 215 weekly returns · dividend-adjusted

4.1 years
THLV +44.4%, VOO +111.1%, Sep 2022 to Nov 2026, distributions reinvested.
MeasureTHLVVOOEdge
Return
Total return+44.4%+111.1%VOO
Annualized+9.3%+19.8%VOO
Price return+35.6%+99.0%VOO
MeasureTHLVVOOEdge
Risk
Volatility11.5%14.4%THLV
Max drawdown−12.3%−16.7%THLV
Upside capture46.2%100.0%VOO
Downside capture69.6%100.0%THLV
MeasureTHLVVOOEdge
Risk-adjusted
Sharpe ratio0.441.01VOO
Sortino ratio0.631.58VOO
MeasureTHLVVOOEdge
Alpha vs VOO
Alpha, a year−3.6%Not significant
Alpha t-stat−0.95
Beta to VOO0.591.00Lower beta

Computed by ETFIQ from Tiingo daily prices and ETFIQ's distribution records; risk-free rate: U.S. Treasury, Daily Treasury Bill Rates, 13-week coupon equivalent Method · Data

Total return

What you earned

THLV +0.6%, VOO −2.7%: total return over one month to Nov 12, 2026.
$10,000 in THLV would be $10,060, over one month to Nov 12, 2026.
THLV+0.6%
VOO−2.7%
THLV −4.4%, VOO −2.4%: total return over three months to Nov 12, 2026.
$10,000 in THLV would be $9,560, over three months to Nov 12, 2026.
THLV−4.4%
VOO−2.4%
THLV −2.8%, VOO +1.8%: total return over six months to Nov 12, 2026.
$10,000 in THLV would be $9,720, over six months to Nov 12, 2026.
THLV−2.8%
VOO+1.8%
THLV +5.7%, VOO +12.0%: total return year to date, Dec 31, 2025 to Nov 12, 2026.
$10,000 in THLV would be $10,570, year to date, Dec 31, 2025 to Nov 12, 2026.
THLV+5.7%
VOO+12.0%
THLV +5.7%, VOO +12.1%: total return over one year to Nov 12, 2026.
$10,000 in THLV would be $10,570, over one year to Nov 12, 2026.
THLV+5.7%
VOO+12.1%
THLV +39.7%, VOO +78.8%: total return over three years to Nov 12, 2026.
$10,000 in THLV would be $13,970, over three years to Nov 12, 2026.
THLV+39.7%
VOO+78.8%
THLV +38.9%, VOO +104.3%: total return since launch to Nov 12, 2026.
$10,000 in THLV would be $13,890, since launch to Nov 12, 2026.
THLV+38.9%
VOO+104.3%
Fees over time · hypothetical
Fees paid
$622
Of the amount
6.2%

At THLV’s 0.64% a year, taken each year from the amount after growth. Hypothetical.

THOR Equal Weight Low Volatility Index

How concentrated, and what does it cost?

+5.7%
Total return, 1 year
0.64%
Expense ratio
7
Holdings
−5.7%
Below its high
1.7%
12-month yield, capital gains included, on its starting price
$0.5295
Last payment (paid annually), ex-date Dec 12, 2025
Sector mix
Cost against like funds

11 committee seats read THLV on data as of Nov 12, 2026: 0 Supports, 2 Mixed, 4 Challenges, 5 without enough data.

0 Supports2 Mixed4 Challenges5 Not enough data
  • Bogle
  • Graham
  • Buffett & Munger
  • Lynch
  • Templeton
  • Dalio
  • Marks
  • Druckenmiller
  • Swensen
  • Wood
  • Livermore
  • Skeptic

Watch the committee read THLV How the committee works

12 seats on THLV, as of Nov 12, 2026: 2 Mixed, 4 Challenges, 5 Not enough data, 1 Does not apply.

In the tradition ofJohn BogleBogle-style Low CostMixed
In the tradition ofBenjamin GrahamGraham-style Margin of SafetyDoes not apply
In the tradition ofWarren Buffett & Charlie MungerBuffett & Munger-style QualityNot enough data
In the tradition ofPeter LynchLynch-style Growth at a Reasonable PriceNot enough data
In the tradition ofJohn TempletonTempleton-style Global ContrarianNot enough data
In the tradition ofRay DalioDalio-style All-WeatherNot enough data
In the tradition ofHoward MarksMarks-style Cycles & RiskChallenges
In the tradition ofStanley DruckenmillerDruckenmiller-style Macro & LiquidityChallenges
In the tradition ofDavid SwensenSwensen-style DiversificationMixed
In the tradition ofCathie WoodWood-style Disruptive InnovationNot enough data
In the tradition ofJesse LivermoreLivermore-style Trend FollowingChallenges
Uses ETFIQ’s measuresETFIQ SkepticETFIQ’s own seatChallenges
Put THLV to the committee →See all seats →No investor named is affiliated with or endorses ETFIQ. Not investment advice.

Risk Officer

Risk check

What to look at before you hold THLV. Not advice.

As of Nov 13, 2026, THLV crossed 0 of 4 ETFIQ risk lines.

OverlapNot publishedNot published
Trading costNot publishedNot published
Premium or discountNot publishedNot published
ClosureNo closure flagClear

Lines and sources: Method. Check several funds at once on My Portfolio.

More on THLV

Every number below is on this page. Open what you need.

The week's ETF fund flows, by email on Sundays.

One-click unsubscribe. See Privacy.

Price, 1 year

$31.58−0.5%1 day, priceClose, Nov 12, 2026

Price only. Total return over the same days, distributions reinvested, was +5.7%. Computed by ETFIQ from Tiingo daily prices.

Source: Tiingo end-of-day prices. Data as of Nov 12, 2026. Updated every trading night. Report a data error

Points (pts) are percentage points.

THLV returns by window: total return, cash paid and price change
WindowTotal returnBenchmark (VOO)Gap to VOO
1M Oct 13 – Nov 12, 2026+0.6%−2.7%+3.3 pts
3M Aug 13 – Nov 12, 2026−4.4%−2.4%−2.0 pts
6M May 14 – Nov 12, 2026−2.8%+1.8%−4.6 pts
YTD Dec 31, 2025 – Nov 12, 2026+5.7%+12.0%−6.3 pts
1Y Nov 12, 2025 – Nov 12, 2026+5.7%+12.1%−6.4 pts
3Y Nov 13, 2023 – Nov 12, 2026+39.7%+78.8%−39.1 pts
Since launch Sep 13, 2022 – Nov 12, 2026+38.9%+104.3%−65.4 pts
Since launch, annualised Sep 13, 2022 – Nov 12, 2026+8.2%––

Total returns, distributions reinvested.

Source: Tiingo end-of-day prices, with distributions reinvested.

THLV key stats

52-week high, daily closes to Nov 12, 2026 (ETFIQ)$33.47 on Jul 6, 2026
52-week low, daily closes to Nov 12, 2026 (ETFIQ)$29.39 on Nov 20, 2025
Close on Nov 12, 2026, within that range (ETFIQ)$31.58, 54% of the way from the low to the high
Holdings7
Range, beta and R-squared computed by ETFIQ from Tiingo daily prices.

Trading

as of Nov 11, 2026
Trading · THLVas of Nov 11, 2026
·
Not scored1 of 6 measured · Nov 11, 2026
0 · Hard to tradeIQ Liquidity Score100 · Trades like a giant
Cost for your order · one way, half its 30-day median spread
How to tradeSpread not read.
Full trading page: components, premium history, dealers →

THLV for holders outside the US

US tax withheld on dividends, no treaty30%
Treaty rates on dividends (IRS table, read Oct 30, 2026)65 countries, 10% to 30%
THLV interest-related and short-term gain dividendsnot read by ETFIQ
US estate tax filing threshold, non-resident holders$60,000
Share classDistributing

THLV is a US fund. Stock of US corporations counts as US property for a non-resident's estate. Facts from the IRS, not tax advice. How withholding and treaties work

About THLV

What it tracksTHOR Equal Weight Low Volatility Index
Fund typeEquity fund
Category (ETFIQ)Stocks · U.S. mid-cap value
Region (ETFIQ)United States
Expense ratio (485BPOS XBRL, Dec 23, 2025)0.64%
Price$31.58
First tradedSep 13, 2022
Net assets (SEC N-PORT, whole fund, as filed for Aug 31, 2026)$56mReport
Benchmark (ETFIQ, from its filings)S&P 500 Index, measured by VOO, which tracks the same index
Benchmark named inits shareholder report, N-CSRS, May 6, 2026
Why this benchmarkNo other fund tracks the THOR Equal Weight Low Volatility Index, the index its prospectus names. Its daily returns fit VOO at R-squared 0.45 over the year to Nov 12, 2026 (251 days), above the 0.30 floor.
THLV, 1 year to Nov 12, 2026+5.7%
VOO, the same days+12.1%
Against its benchmark, 1 year (ETFIQ)−6.4 pts
Below its high (ETFIQ)−5.7%
Holdings7
Top ten weightnot published
Holdings as of (SEC N-PORT)Aug 31, 2026
Why no share is publishedHoldings are gross exposure, not a portfolio
Already in the S&P 500, by weight (ETFIQ)0.0%
Active share vs the S&P 500 (ETFIQ)100.0%
Already in the Nasdaq-100, by weight (ETFIQ)0.0%
Promise checkNot measured. No other ETF tracks the index it names, so its tracking cannot be measured.
How we measure
Holdings for THLV are read from the THOR Low Volatility ETF filing, which tracks the same index; THLV files on a different schedule.

Questions people ask about THLV

How has THLV performed?
Over the year to Nov 12, 2026, THLV returned +5.7% with distributions reinvested, against +12.0% for the S&P 500. Over three years the number is +39.7%.
What does THLV cost?
The prospectus expense ratio is 0.64% a year.
What does THLV hold?
7 positions as filed for Aug 31, 2026, with the top ten at not published of the fund. 0% of its weight is in stocks the S&P 500 also holds.
How far is THLV below its high?
5.7% below its high of Jul 6, 2026, measured on the reinvested series to Nov 12, 2026.
Sources and dates
Prices, THLV and Benchmark (VOO)Tiingo end-of-day · Nov 12, 2026
Net assets, $56mSEC N-PORT, whole fund · Aug 31, 2026

Links are sources, not endorsements.

Cite this pageCitation, APA and Markdown

ETFIQ, THLV, stock fund, data as of Nov 12, 2026. https://etfiq.com/funds/thlv

Free to use with attribution for data ETFIQ computes; issuer data stays under its owner's terms. The underlying files are at Open data.

Embed this chart

Free to use with the credit link. Paste this where the chart should go; it updates every trading night.
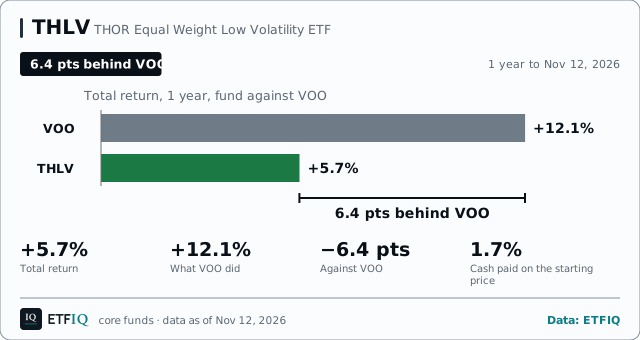
THLV: THLV over 1 year: total return +5.7%, its benchmark S&P 500 Index through VOO +12.1%, −6.4 pts. Data to Nov 12, 2026.
<figure style="margin:0;max-width:640px">
<iframe src="https://etfiq.com/embed/core/thlv/" title="THLV: THLV over 1 year: total return +5.7%, its benchmark S&amp;P 500 Index through VOO +12.1%, −6.4 pts. Data to Nov 12, 2026." width="640" height="370" loading="lazy" style="border:0;max-width:100%;width:100%"></iframe>
<figcaption style="font:13px/1.5 sans-serif">THLV: THLV over 1 year: total return +5.7%, its benchmark S&amp;P 500 Index through VOO +12.1%, −6.4 pts. Data to Nov 12, 2026. Data: <a href="https://etfiq.com/funds/thlv">ETFIQ</a></figcaption>
</figure>

How to embed ETFIQ charts

Get the ETFIQ Daily

The day's ETF flows, a comparison and one number. Every trading morning. About the Daily

The ETFIQ Daily and our other emails. Unsubscribe from any one in a click. See Privacy.

Snapshot, Nov 12, 2026. More on the tabs above.