
SOLZ Solana ETF

A registered fund holding Solana futures. It trades like a share.Volatility Shares1.64% fee$114m on Oct 19, 2026First traded Mar 20, 2025SEC filings ↗Every Volatility Shares fund ETFIQ coversDividend history

Over the year to Oct 20, 2026, SOLZ lost 45.8%, against −43.9% for Solana.

−45.8%
Total return, 1 year
−43.9%
Solana over the same days
−3.4%
Difference against Solana, compounded
399
Days it has traded

No Coin Capture Score.

Why

SOLZ has the figure, but its set, crypto futures and strategy ETFs with a full year, has 7 funds, under the twelve a percentile needs. A fund outside a ranked set has no score rather than a low one. All crypto ETFs ranked by it · How it is computed

Ask IQ about this page

Ask IQ about SOLZ

Answers cite the figures on this page.

Get the week's ETF fund flows by email, every Monday.

Plus the Friday ETF note. Confirm from the link that arrives, and unsubscribe in one click. See Privacy.

SOLZ returns by window: total return, cash paid and price change
WindowTotal returnSolanaDifference, percentage points
1M Sep 18 – Oct 20, 2026−7.6%−7.1%−0.5 pts
3M Jul 21 – Oct 20, 2026+35.4%+36.2%−0.7 pts
6M Apr 21 – Oct 20, 2026+24.1%+25.3%−1.3 pts
YTD Dec 31, 2025 – Oct 20, 2026−16.1%−14.5%−1.6 pts
1Y Oct 20, 2025 – Oct 20, 2026−45.8%−43.9%−3.4% of its growth
Since launch Mar 20, 2025 – Oct 20, 2026−26.6%−17.1%−11.4% of its growth
Since launch, annualised Mar 20, 2025 – Oct 20, 2026−17.7%––

Total return at closing prices, distributions reinvested. Year to date runs from the last close of the year before. Annualised is the steady yearly rate that gives the since-launch total over the same days. Not shown: 3 years, which the fund has not been listed long enough to fill (listed Mar 2025); its since-launch row covers all of its record. Source: ETFIQ.

Source: Tiingo end-of-day prices, with distributions reinvested. Data as of Oct 20, 2026. Updated every trading night. Last checked Oct 21, 2026. Report a data error

Money in and out

Monthly figures · as of May 31, 2026

SOLZ: in the month to May 31, 2026, net $5.2m went out, by its SEC filing.

12 months
+$217m
1,083.4% of $20.1m on May 31, 2025
Jun 1, 2025 to May 31, 2026
monthly, from SEC filings
Since Mar 2025
+$237m
Mar 1, 2025 to May 31, 2026
monthly, from SEC filings

Computed by ETFIQ from the monthly sales and redemptions SOLZ files with the SEC on Form N-PORT.

How this is computed

ETFIQ reads no daily figures for this fund, so its flows are monthly, and the latest month filed is May 2026. Every day and month ETFIQ holds for SOLZ, back to Mar 2025, is in its flows file. Flows across every fund · How these flows are computed · Compare SOLZ with other funds in the flows tool

Month by month, money in and money outMar 2025 to May 2026

SOLZ, money in and money out each month from Mar 2025 to May 2026: two bars a month, money in above the line and money out below. Every bar is from SOLZ’s SEC filings (N-PORT item B.6). Of the 15 months listed, money came in on net in 12 and went out in 3.

Every bar is from SOLZ’s SEC filings (N-PORT item B.6). Of the 15 months listed, money came in on net in 12 and went out in 3.

MonthInOutNet
May 2026 SEC Form N-PORT+$2.4m−$7.5m−$5.2m
Apr 2026 SEC Form N-PORT+$5.8m−$4.3m+$1.5m
Mar 2026 SEC Form N-PORT+$21.9m−$6.9m+$15.0m
Feb 2026 SEC Form N-PORT+$11.7m−$5.0m+$6.7m
Jan 2026 SEC Form N-PORT+$20.5m−$12.4m+$8.2m
Dec 2025 SEC Form N-PORT+$9.4m−$7.6m+$1.9m
Nov 2025 SEC Form N-PORT+$4.5m−$29.2m−$24.8m
Oct 2025 SEC Form N-PORT+$40.9m−$44.7m−$3.8m
Sep 2025 SEC Form N-PORT+$98.8m−$15.8m+$83.0m
Aug 2025 SEC Form N-PORT+$74.1m−$7.9m+$66.2m
Jul 2025 SEC Form N-PORT+$66.8m−$1.2m+$65.6m
Jun 2025 SEC Form N-PORT+$3.5m−$492k+$3.0m
May 2025 SEC Form N-PORT+$11.7m−$1.0m+$10.7m
Apr 2025 SEC Form N-PORT+$6.8m−$966k+$5.8m
Mar 2025 SEC Form N-PORT+$3.6m−$637k+$3.0m

Most recent first.

How this is computed

N-PORT months: money in is sales plus reinvestments; money out is redemptions.

N-PORT months are the filed sales plus reinvestments less redemptions. Later months add up the daily figures; the Source column names any missing day.

Source: ETFIQ, from the fund’s SEC N-PORT filings. Data as of May 31, 2026. Updated when the fund files its next report. Report a data error

SOLZ key stats

52-week high, daily closes to Oct 20, 2026 (ETFIQ)$20.98 on Oct 27, 2025
52-week low, daily closes to Oct 20, 2026 (ETFIQ)$6.35 on Jun 5, 2026
Close on Oct 20, 2026, within that range (ETFIQ)$10.51, 28% of the way from the low to the high
Beta to its benchmark, 1 year (ETFIQ)1.02, against solana
R-squared, the same days (ETFIQ)1.00
Beta and R-squared measured over251 daily total returns, Oct 21, 2025 to Oct 20, 2026
Range, beta and R-squared computed by ETFIQ from Tiingo daily prices.

About SOLZ

Doing it would read −1.9 pts, which is correct and describes nothing a holder can act on: what the figure above states is the gap between the two growth factors, so a fund that kept 97% of what holding the coin gave says exactly that. SOLZ is a registered investment company: it files a monthly N-PORT rather than a 10-K.
SponsorVolatility Shares
HoldsSolana futures
Measured againstSolana at 4pm New York, the coin it reaches
Cash fund (N-PORT, May 31, 2026)49.7% of net assets
Other security (N-PORT, May 31, 2026)155.0% of net assets
Derivative (N-PORT, May 31, 2026)−4.0% of net assets
Borrowed under a reverse repurchase agreement (N-PORT, May 31, 2026)−153.2% of net assets, the filing’s own figure
Other assets less other liabilities (N-PORT, May 31, 2026)52.4% of net assets, from the filing’s own totals
Expense ratio (485BPOS XBRL)1.64%Report
Net assets (issuer page, as of Oct 19, 2026)$114mReport
Stakingpossible on this chain; ETFIQ has read no clear answer in the filings
First tradedMar 20, 2025
Days traded399
Days it closed unchanged2
Quotedon an exchange, every trading day
Price$10.51
How we measure
A holder gets exposure to Solana without the fund holding the coin itself. Over the year to Oct 20, 2026, Solana moved −43.9% and SOLZ returned −45.8%. That leaves it 3.4% behind once both returns are compounded. Over a window this long the two returns cannot simply be subtracted. That difference is the fee, the cost of rolling the futures from one month to the next, what the futures traded at against Solana, and what the market paid for the shares, all of it together. It is the only figure on this page the sponsor does not publish itself. Solana is a proof of stake chain, so a fund holding it can stake. ETFIQ has not read a clear answer either way out of SOLZ’s filings.
Fund closes and coin closes from Tiingo, read at the same two dates. ETFIQ calculation. How these figures are computed

Questions people ask about SOLZ

Does SOLZ track Solana?
Over the year to Oct 20, 2026 it returned −45.8% against Solana’s −43.9%, which leaves it 3.4% behind once both returns are compounded. That difference carries the fee, the cost of rolling futures and the market’s pricing of the shares, and ETFIQ computes it from the fund’s own closes and the coin’s own closes over the same two dates.
Does SOLZ stake?
SOLZ holds Solana futures rather than Solana itself, so there is nothing for it to stake.
What is SOLZ?
Solana ETF, a fund registered under the Investment Company Act that holds Solana futures to reach Solana, from Volatility Shares, first traded Mar 20, 2025. It files a monthly N-PORT listing what it holds.
Cite this pageCitation, APA and Markdown

ETFIQ, SOLZ, crypto ETFs, data as of Oct 20, 2026. https://etfiq.com/funds/solz

Open SOLZ live on ETFIQ

Free to use with attribution for figures ETFIQ computes; issuer data stays under its owner's terms. The underlying files are at Open data.

Tracking difference
The fund’s total return minus the coin’s over exactly the same days, in percentage points. The fee, the custody cost, the creation and redemption friction and whatever the market paid for the shares, all of it, in one number.
Spot
The fund holds the coin itself, through a custodian, rather than futures on it or shares in companies that own it. Only spot funds are in this category; the others are measured where they belong.
Sponsor
Who runs the fund. Most spot crypto ETFs are 1933 Act trusts rather than registered investment companies, so they have a sponsor rather than an adviser, and file a 10-K rather than an N-PORT.
Thinly quoted
A fund whose price sat unchanged on more than one trading day in twenty. Its quoted return is what somebody paid on the days anyone traded, which is not the same thing as what the fund did, so ETFIQ shows it and does not rank it against funds that trade.
Staking
Only proof of stake coins can be staked, so it exists for ether and Solana funds and cannot exist for a bitcoin one. Where a fund stakes, the yield and the sponsor’s share of it are terms in its own filings.
Embed this chart

Free to use with the credit link. Paste this where the chart should go; it updates every trading night.
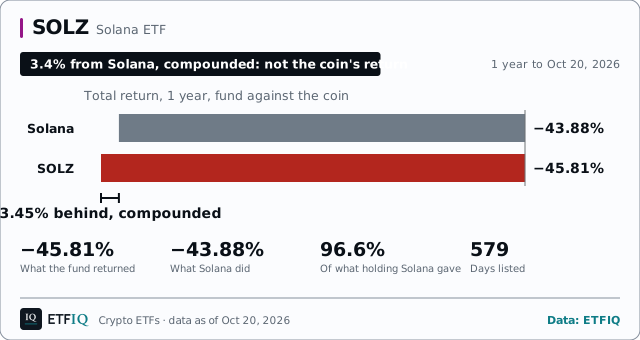
SOLZ: SOLZ over 1 year: fund −45.81%, Solana −43.88%, 3.45% behind Solana, compounded. Figures to Oct 20, 2026.
<figure style="margin:0;max-width:640px">
<a href="https://etfiq.com/funds/solz"><img src="https://etfiq.com/assistant/api/embed/crypto/solz.svg" alt="SOLZ: SOLZ over 1 year: fund −45.81%, Solana −43.88%, 3.45% behind Solana, compounded. Figures to Oct 20, 2026." width="640" style="max-width:100%;height:auto"></a>
<figcaption style="font:13px/1.5 sans-serif">SOLZ: SOLZ over 1 year: fund −45.81%, Solana −43.88%, 3.45% behind Solana, compounded. Figures to Oct 20, 2026. Data: <a href="https://etfiq.com/funds/solz">ETFIQ</a></figcaption>
</figure>

How to embed ETFIQ charts

Get the weekly ETF note

Four ranked ETF lists in one email every Friday morning. The last note

Confirm from the link that arrives, and unsubscribe in one click. See Privacy.