
HYNX T-REX 2X Long SKHY Daily Target ETF

$14.00
−6.4% · 1 day, price
Share ▾
Share on XDownload as PDF
Embed ▾

Free to use with the credit link. It updates every trading night.

Fund card

<iframe src="https://etfiq.com/embed/fund/hynx/" title="ETFIQ HYNX analysis" width="100%" height="420" loading="lazy" style="border:0;max-width:600px"></iframe>
<p>Data: <a href="https://etfiq.com/funds/hynx">ETFIQ HYNX analysis</a></p>

Daily flows

<iframe src="https://etfiq.com/embed/flows-strip/hynx/" title="ETFIQ HYNX fund flows" width="100%" height="340" loading="lazy" style="border:0;max-width:600px"></iframe>
<p>Data: <a href="https://etfiq.com/funds/hynx">ETFIQ HYNX fund flows</a></p>

How to embed ETFIQ charts

Over the three months to Nov 12, 2026, HYNX lost 42.6%, against −40.5% for twice SKHY's daily moves.

Total return since launch
−63.9%SKHY −29.0% to Nov 12, 2026
Expense ratio
1.25%a year
Net assets
$26mon Nov 11, 2026
Net flow, latest day
$0daily basis to Nov 11, 2026
Aims to return twice the daily move of SK hynix (SKHY)T-REX ↗Expense ratio 1.25%Fund assets $26m on Nov 11, 2026First traded Jul 14, 2026Benchmark SKHYFund page at the issuer ↗SEC filings ↗Every T-REX fund ETFIQ covers

Did what it promises: PartlyOver three months to Nov 12, 2026, HYNX finished 2.1 points behind twice SKHY's daily moves, compounded.

Growth of $10,000

HYNX vs SKHY, since Jul 2026

Total return, distributions reinvested, Jul 14, 2026 to Nov 11, 2026.

HYNX $3,856 −61.4%SKHY $7,337 −26.6%Returns from daily closes. Data
Scorecard · vs SKHY

HYNX risk and return scorecard

vs SKHY · Jul 24, 2026 to Nov 6, 2026 · 15 weekly returns · dividend-adjusted

Short history · 3 months
HYNX −47.5%, SKHY −17.6%, Jul 24, 2026 to Nov 6, 2026, distributions reinvested.

15 weekly returns: annualized numbers and ratios need 52.

MeasureHYNXSKHYEdge
Return
Total return−47.5%−17.6%SKHY
Price return−47.5%−17.6%SKHY
MeasureHYNXSKHYEdge
Risk
Max drawdown−61.5%−34.7%SKHY
MeasureHYNXSKHYEdge
Alpha vs SKHY
Beta to SKHY1.971.00Higher beta

Computed by ETFIQ from Tiingo daily prices and ETFIQ's distribution records; risk-free rate: U.S. Treasury, Daily Treasury Bill Rates, 13-week coupon equivalent Method · Data

Net fund flows · daily basis · as of Nov 11, 2026

Money in and out

Latest day
$0
N-PORT monthly basis
Since Nov 2026
$0
N-PORT monthly basis
No money in or out. 62 days missing.
Total return

What you earned

HYNX −30.5%, SKHY −12.3%: total return over one month to Nov 12, 2026.
$10,000 in HYNX would be $6,950, over one month to Nov 12, 2026.
HYNX−30.5%
SKHY−12.3%
HYNX −42.6%, SKHY −16.9%: total return over three months to Nov 12, 2026.
$10,000 in HYNX would be $5,740, over three months to Nov 12, 2026.
HYNX−42.6%
SKHY−16.9%
HYNX −63.9%, SKHY −29.0%: total return since launch to Nov 12, 2026.
$10,000 in HYNX would be $3,610, since launch to Nov 12, 2026.
HYNX−63.9%
SKHY−29.0%
Fees over time · hypothetical
Fees paid
$1,182
Of the amount
11.8%

At HYNX’s 1.25% a year, taken each year from the amount after growth. Hypothetical.

Cost to trade · hypothetical
One way
$18.00
Round trip
$36.00
A year
$36.00

One way: half its 30-day median bid-ask spread; from $100,000, plus ETFIQ’s estimate of price impact, as of Nov 11, 2026. A round trip buys and later sells the same size. Hypothetical. Trading page

Sets out to return 2 times the daily move of SKHY

Did it deliver its multiple?

−16.9%
What SKHY did
−40.5%
What 2 times a day gives
−42.6%
What the fund returned
−2.1 pts
Gap to 2 times a day
Stated multiple against delivered, by window
1M
−30.5%
3M
−42.6%
Launch
−63.9%
Black line is the stated multiple of the underlying's move.
Two-day reversal, hypothetical
If SKHY rises 2% one day and falls 2% the next, it ends −0.04%. A daily 2× fund ends −0.16%, 4.0 times the index’s loss. Hypothetical.
If SKHY rises 5% one day and falls 5% the next, it ends −0.25%. A daily 2× fund ends −1.00%, 4.0 times the index’s loss. Hypothetical.
If SKHY rises 10% one day and falls 10% the next, it ends −1.00%. A daily 2× fund ends −4.00%, 4.0 times the index’s loss. Hypothetical.
Formula: (1 + L·m)(1 − L·m) − 1 for a move m up then down at multiple L. Hypothetical; not a forecast.

10 committee seats read HYNX on data as of Nov 12, 2026: 0 Supports, 1 Mixed, 4 Challenges, 5 without enough data.

0 Supports1 Mixed4 Challenges5 Not enough data
  • Bogle
  • Graham
  • Buffett & Munger
  • Lynch
  • Templeton
  • Dalio
  • Marks
  • Druckenmiller
  • Swensen
  • Wood
  • Livermore
  • Skeptic

Watch the committee read HYNX How the committee works

12 seats on HYNX, as of Nov 12, 2026: 1 Mixed, 4 Challenges, 5 Not enough data, 2 Does not apply.

In the tradition ofJohn BogleBogle-style Low CostChallenges
In the tradition ofBenjamin GrahamGraham-style Margin of SafetyNot enough data
In the tradition ofWarren Buffett & Charlie MungerBuffett & Munger-style QualityNot enough data
In the tradition ofPeter LynchLynch-style Growth at a Reasonable PriceNot enough data
In the tradition ofJohn TempletonTempleton-style Global ContrarianDoes not apply
In the tradition ofRay DalioDalio-style All-WeatherChallenges
In the tradition ofHoward MarksMarks-style Cycles & RiskNot enough data
In the tradition ofStanley DruckenmillerDruckenmiller-style Macro & LiquidityDoes not apply
In the tradition ofDavid SwensenSwensen-style DiversificationChallenges
In the tradition ofCathie WoodWood-style Disruptive InnovationNot enough data
In the tradition ofJesse LivermoreLivermore-style Trend FollowingChallenges
Uses ETFIQ’s measuresETFIQ SkepticETFIQ’s own seatMixed
Put HYNX to the committee →See all seats →No investor named is affiliated with or endorses ETFIQ. Not investment advice.

Risk Officer

Risk check

What to look at before you hold HYNX. Not advice.

As of Nov 13, 2026, HYNX crossed 2 of 6 ETFIQ risk lines.

OverlapNot publishedNot published
Trading cost30-day median spread 0.36%Clear
Premium or discount95% of days within ±0.2477% of NAV, 0 days over 1%, Nov 6, 2026 to Nov 11, 2026Clear
Promise checkPartly deliveredPartly delivered: Over three months to Nov 12, 2026, HYNX finished 2.1 points behind twice SKHY's daily moves, compounded.Flag
Leverage2x daily resetHYNX is a 2x daily-reset fund; its 3M return was -8.8 points from the stated multiple of its underlying.Flag
ClosureNo closure flagClear

Lines and sources: Method. Check several funds at once on My Portfolio.

More on HYNX

Every number below is on this page. Open what you need.

HYNX flows, by email on Sundays.

One-click unsubscribe. See Privacy.

Price since launch, Jul 14, 2026

$14.00−6.4%1 day, priceClose, Nov 12, 2026

Price only. No distribution was paid over these days, so total return is the same. Computed by ETFIQ from Tiingo daily prices.

Source: Tiingo end-of-day prices. Data as of Nov 12, 2026. Updated every trading night. Report a data error

HYNX returns by window: total return, cash paid and price change
WindowTotal returnSKHY+2x the moveDifferenceSKHY moved about, annualized
1M Oct 13 – Nov 12, 2026−30.5%−12.3%−24.6%−5.9 pts97%
3M Aug 13 – Nov 12, 2026−42.6%−16.9%−33.8%−8.8 pts75%
Since launch Jul 14 – Nov 12, 2026−63.9%−29.0%−58.0%−5.9 pts89%

Total returns, distributions reinvested. +2x the move is +2 times the window's move. That is not the fund's objective, which is +2 times each day's move. Listed Jul 2026: no 6 months, year to date, 1 year and 3 years windows.

Source: Tiingo end-of-day prices, with distributions reinvested.

What it aimed at, and what it did
5.9 pts short of its stated multipleHYNX returned −30.5% while 2 times SKHY's move would have been −24.6%. Data from Oct 13, 2026 to Nov 12, 2026.SKHY −12.3% ×2 implies−24.6%HYNX returned−30.5%5.9 pts short of its stated multipleHYNX returned −30.5% while 2 times SKHY's move would have been −24.6%. Data from Oct 13, 2026 to Nov 12, 2026.SKHY −12.3% ×2 implies−24.6%HYNX returned−30.5%

Over the 1 month to Nov 12, 2026, HYNX returned −30.5%, where 2 times that move implies −24.6%. The difference is −5.9 pts. Of that, daily compounding is −4.9 pts and the gap to 2 times each day's move compounded is −1.0 pts.

8.8 pts short of its stated multipleHYNX returned −42.6% while 2 times SKHY's move would have been −33.8%. Data from Aug 13, 2026 to Nov 12, 2026.SKHY −16.9% ×2 implies−33.8%HYNX returned−42.6%8.8 pts short of its stated multipleHYNX returned −42.6% while 2 times SKHY's move would have been −33.8%. Data from Aug 13, 2026 to Nov 12, 2026.SKHY −16.9% ×2 implies−33.8%HYNX returned−42.6%

Over the 3 months to Nov 12, 2026, HYNX returned −42.6%, where 2 times that move implies −33.8%. The difference is −8.8 pts. Of that, daily compounding is −6.7 pts and the gap to 2 times each day's move compounded is −2.1 pts.

5.9 pts short of its stated multipleHYNX returned −63.9% while 2 times SKHY's move would have been −58.0%. Data from Jul 14, 2026 to Nov 12, 2026.SKHY −29.0% ×2 implies−58.0%HYNX returned−63.9%5.9 pts short of its stated multipleHYNX returned −63.9% while 2 times SKHY's move would have been −58.0%. Data from Jul 14, 2026 to Nov 12, 2026.SKHY −29.0% ×2 implies−58.0%HYNX returned−63.9%

From launch to Nov 12, 2026, HYNX returned −63.9%, where 2 times that move implies −58.0%. The difference is −5.9 pts. Of that, daily compounding is −3.8 pts and the gap to 2 times each day's move compounded is −2.1 pts.

47.7
IQ Leverage ScoreETFIQ 3-Month Tracking Score261st of 498 · Nov 12, 2026
0.1 · lowest of 498 leveraged ETFs at 2x, over three months99.9 · highest

How closely it delivered its daily multiple over 3 months, ranked against 498 leveraged ETFs at 2x, over three months. 100 is best. How it is computed

HYNX finished 2.1 points short of what +2 times SKHY’s daily move would have given, compounded through the same days.

points against its daily multiple, compounded−2.1 pts · 48th pct

Money in and out

Daily data · as of Nov 11, 2026

HYNX: in the 3 trading days to Nov 11, 2026, nothing net moved.

1D
$0
0.0% of $21.9m on Nov 10, 2026
Nov 11, 2026
Since Nov 2026
$0
Nov 9, 2026 to Nov 11, 2026
Net flow each trading day
Net flow into HYNX each trading day, Aug 12, 2026 to Nov 11, 2026monthly, from SEC filingsdaily, from T-REXAug 12, 2026Nov 11, 2026

HYNX, net flow each trading day over the 65 sessions from Aug 12, 2026 to Nov 11, 2026: money came in on 0 days and went out on 0 days, of the 3 days with daily data; the other 62 have none. Before Nov 9, 2026 ETFIQ has the fund’s monthly data only, from SEC filings: that span is shaded and draws no bars, and its months are in the month by month list.

No money in or out. 62 days missing.

Net flow into HYNX each trading day, Nov 12, 2025 to Nov 11, 2026monthly, from SEC filingsdaily, from T-REXNov 12, 2025Nov 11, 2026

HYNX, net flow each trading day over the 251 sessions from Nov 12, 2025 to Nov 11, 2026: money came in on 0 days and went out on 0 days, of the 3 days with daily data; the other 248 have none. Before Nov 9, 2026 ETFIQ has the fund’s monthly data only, from SEC filings: that span is shaded and draws no bars, and its months are in the month by month list.

No money in or out. 248 days missing.

Net flow into HYNX each trading day, Apr 10, 2025 to Nov 11, 2026monthly, from SEC filingsdaily, from T-REXApr 10, 2025Nov 11, 2026

HYNX, net flow each trading day over the 400 sessions from Apr 10, 2025 to Nov 11, 2026: money came in on 0 days and went out on 0 days, of the 3 days with daily data; the other 397 have none. Before Nov 9, 2026 ETFIQ has the fund’s monthly data only, from SEC filings: that span is shaded and draws no bars, and its months are in the month by month list.

No money in or out. 397 days missing.

Money in, netMoney out, netMonthly basis

Daily data starts Nov 9, 2026.

How this is computed

Computed by ETFIQ from T-REX’s daily data: each day’s change in shares outstanding times the previous day’s net asset value. Percentages are of net assets at the start of each window. Numbers are net: money in less money out. Every day and month ETFIQ holds for HYNX, back to Nov 2026, is in its flows file. Flows across every fund · How these flows are computed · Compare HYNX with other funds in the flows tool

Every trading day, last 3 months3 days
Nov 11, 2026 $0
Nov 10, 2026 $0
Nov 9, 2026 $0

Most recent first.

Week by week, last year1 week
Nov 11, 2026 $0 3 days

Net flow into HYNX each week, Nov 9, 2026 to Nov 11, 2026, most recent first, each week named by its last trading day with data. Computed by ETFIQ.

Month by month, money in and money outNov 2026

HYNX, net flow each month from Nov 2026 to Nov 2026: money came in in 0 months and went out in 0 months.

MonthInOutNet
Nov 2026 ETFIQ, the sum of its days, Nov 9 to Nov 11$0$0$0

Most recent first.

How this is computed

Months summed from daily data: money in adds the days money came in; money out adds the days it went out.

N-PORT months are the filed sales plus reinvestments less redemptions. Later months add up the daily data; the Source column names any missing day.

Source: ETFIQ, from the fund’s daily share counts and net asset values, and its SEC N-PORT filings. Data as of Nov 11, 2026. Last checked Nov 13, 2026.

HYNX key stats

High since Jul 14, 2026, daily closes to Nov 12, 2026 (ETFIQ)$38.77 on Jul 14, 2026
Low since Jul 14, 2026, daily closes to Nov 12, 2026 (ETFIQ)$11.34 on Nov 5, 2026
Close on Nov 12, 2026, within that range (ETFIQ)$14.00, 10% of the way from the low to the high
Range, beta and R-squared computed by ETFIQ from Tiingo daily prices.

Trading

as of Nov 11, 2026
Trading · HYNXas of Nov 11, 2026
·
Not scored2 of 6 measured · Nov 11, 2026
0 · Hard to tradeIQ Liquidity Score100 · Trades like a giant
Cost for your order · one way, half its 30-day median spread
$1,000$1.800.18%
$10,000$180.18%
$100,000 · estimate$4660.47%
Premium or discount to NAV, Nov 11 close+0.13%
−0.4%95% of days within ±0.25% · the 1% band is off this scale+0.4%
How to tradeLimit: midpoint + 3¢ to buy, midpoint − 3¢ to sell.At the Nov 11 close of $14.95, that’s $14.98 to buy and $14.92 to sell.
Full trading page: components, premium history, dealers →

HYNX for holders outside the US

US tax withheld on dividends, no treaty30%
Treaty rates on dividends (IRS table, read Oct 30, 2026)65 countries, 10% to 30%
HYNX interest-related and short-term gain dividendsnot read by ETFIQ
US estate tax filing threshold, non-resident holders$60,000
Share classDistributing

HYNX is a US fund. Stock of US corporations counts as US property for a non-resident's estate. Facts from the IRS, not tax advice. How withholding and treaties work

Did it keep up with its own daily multiple, compounded day by day, over three months?

Points against its daily multiple, compounded
MRNX −41.5 ptsGMEU −14.1 ptsPUR −12.3 ptsTXXS −11.1 ptsSUIL −10.0 ptsAVAZ −8.6 ptsXOVL −8.5 ptsOSCX −7.6 ptsTXXD −7.6 ptsMSTX −7.5 ptsNXPG −7.0 ptsSTLU −7.0 ptsMSTU −6.9 ptsBMNG −6.7 pts, and 2 more at this point: GMEC −6.7 pts, XXRP −6.7 ptsTDCL −6.4 ptsMSTP −6.3 ptsRIOX −6.0 ptsCRDX −5.8 ptsTEMT −5.6 ptsTEMC −5.4 ptsTTDU −5.4 ptsAMDG −5.3 ptsAMPU −5.1 pts, and 2 more at this point: MSTC −5.1 pts, RBLU −5.1 ptsBMNU −5.0 ptsLLYX −4.9 ptsBTCL −4.8 pts, and 1 more at this point: ETHT −4.8 ptsPENU −4.7 ptsADIU −4.6 pts, and 1 more at this point: CRMG −4.6 ptsAMDL −4.5 pts, and 4 more at this point: OKTG −4.5 pts, OUSL −4.5 pts, SPCU −4.5 pts, UNHG −4.5 ptsBNMC −4.4 ptsFUTG −4.3 pts, and 3 more at this point: INFH −4.3 pts, LUNL −4.3 pts, UXRP −4.3 ptsANEL −4.2 pts, and 7 more at this point: BITU −4.2 pts, EVMU −4.2 pts, POEL −4.2 pts, TELG −4.2 pts, TSLT −4.2 pts, XCOM −4.2 pts, XRPT −4.2 ptsECHX −4.1 ptsCDNG −4.0 pts, and 5 more at this point: ENTL −4.0 pts, ETU −4.0 pts, PDDL −4.0 pts, SOFX −4.0 pts, TSLI −4.0 ptsAMZG −3.9 pts, and 4 more at this point: APPC −3.9 pts, CRWL −3.9 pts, MSIX −3.9 pts, SPOG −3.9 ptsAAPE −3.8 pts, and 7 more at this point: APPX −3.8 pts, BTCU −3.8 pts, DUOG −3.8 pts, LNOK −3.8 pts, SMTG −3.8 pts, SPCH −3.8 pts, VSTL −3.8 ptsBITX −3.7 pts, and 4 more at this point: CARX −3.7 pts, QSU −3.7 pts, RKLX −3.7 pts, TSLG −3.7 ptsAMUU −3.6 pts, and 6 more at this point: COTG −3.6 pts, IOSX −3.6 pts, SPCF −3.6 pts, TSLL −3.6 pts, TSMU −3.6 pts, UCOP −3.6 ptsAMDC −3.5 pts, and 5 more at this point: APHG −3.5 pts, ONDL −3.5 pts, PYPG −3.5 pts, TAJX −3.5 pts, XLEX −3.5 ptsMETG −3.4 pts, and 8 more at this point: NVOX −3.4 pts, PLTG −3.4 pts, SLON −3.4 pts, TESC −3.4 pts, TSLR −3.4 pts, TXNU −3.4 pts, UN −3.4 pts, UNHU −3.4 ptsETHU −3.3 pts, and 6 more at this point: LULG −3.3 pts, MULL −3.3 pts, ONG −3.3 pts, QCML −3.3 pts, UPLT −3.3 pts, XYZG −3.3 ptsAAPX −3.2 pts, and 9 more at this point: CRUC −3.2 pts, FBX −3.2 pts, FDRX −3.2 pts, FGRU −3.2 pts, PLU −3.2 pts, SPAX −3.2 pts, TARK −3.2 pts, XHOA −3.2 pts, XLFX −3.2 ptsAAPU −3.1 pts, and 4 more at this point: BEG −3.1 pts, UPAL −3.1 pts, XEUR −3.1 pts, XLUX −3.1 ptsELIL −3.0 pts, and 9 more at this point: HIMZ −3.0 pts, LMTL −3.0 pts, MNSX −3.0 pts, MSFL −3.0 pts, SKHX −3.0 pts, XAGI −3.0 pts, XLBX −3.0 pts, XLVX −3.0 pts, XOMX −3.0 ptsADBG −2.9 pts, and 14 more at this point: AXTL −2.9 pts, COPZ −2.9 pts, COZX −2.9 pts, KEEX −2.9 pts, MPWX −2.9 pts, MSFX −2.9 pts, NETG −2.9 pts, NVOC −2.9 pts, ONDC −2.9 pts, PLTA −2.9 pts, QCMU −2.9 pts, SKHU −2.9 pts, XIWC −2.9 pts, XTAI −2.9 ptsCCPX −2.8 pts, and 12 more at this point: COIG −2.8 pts, CRCG −2.8 pts, DRAL −2.8 pts, FIGG −2.8 pts, FLYT −2.8 pts, IONX −2.8 pts, PYPU −2.8 pts, SMCC −2.8 pts, SMCX −2.8 pts, TSMG −2.8 pts, XLPX −2.8 pts, XW −2.8 ptsAPHU −2.7 pts, and 9 more at this point: BTDL −2.7 pts, COIA −2.7 pts, LOFF −2.7 pts, MPWC −2.7 pts, MSFC −2.7 pts, MUU −2.7 pts, RGTX −2.7 pts, XBIX −2.7 pts, XKRE −2.7 ptsAAPB −2.6 pts, and 13 more at this point: AMZU −2.6 pts, CRCA −2.6 pts, CRWC −2.6 pts, FBL −2.6 pts, HOOG −2.6 pts, HOOX −2.6 pts, KEYG −2.6 pts, MRAL −2.6 pts, MTSG −2.6 pts, SOLT −2.6 pts, WLDU −2.6 pts, WULX −2.6 pts, XLYX −2.6 ptsAVGG −2.5 pts, and 3 more at this point: METU −2.5 pts, RMBX −2.5 pts, USX −2.5 ptsAMKL −2.4 pts, and 13 more at this point: ASMG −2.4 pts, AVGU −2.4 pts, BRZX −2.4 pts, CRMX −2.4 pts, DJTU −2.4 pts, EQQQ −2.4 pts, ETNG −2.4 pts, NOWL −2.4 pts, RDWU −2.4 pts, ROBN −2.4 pts, RVNL −2.4 pts, TSMX −2.4 pts, XLIX −2.4 ptsAALG −2.3 pts, and 13 more at this point: AMAA −2.3 pts, AMAU −2.3 pts, AVGX −2.3 pts, BULG −2.3 pts, GFSG −2.3 pts, HPEL −2.3 pts, HUTG −2.3 pts, ISUL −2.3 pts, MSFU −2.3 pts, PUL −2.3 pts, WEBX −2.3 pts, WX −2.3 pts, XPEG −2.3 ptsAVGC −2.2 pts, and 14 more at this point: BBUL −2.2 pts, CEGX −2.2 pts, CONL −2.2 pts, CONX −2.2 pts, EMXX −2.2 pts, GRAG −2.2 pts, MCHG −2.2 pts, NTAL −2.2 pts, PLTL −2.2 pts, RIVC −2.2 pts, RTXG −2.2 pts, SKHL −2.2 pts, SNOU −2.2 pts, XPAV −2.2 ptsBEC −2.1 pts, and 16 more at this point: GOU −2.1 pts, IBX −2.1 pts, LASC −2.1 pts, NFLU −2.1 pts, NVDG −2.1 pts, PTIR −2.1 pts, QUBX −2.1 pts, RAM −2.1 pts, RDTL −2.1 pts, RMBC −2.1 pts, SK −2.1 pts, SNAG −2.1 pts, SOUX −2.1 pts, TWSC −2.1 pts, UMCU −2.1 pts, XLKX −2.1 ptsAPMI −2.0 pts, and 19 more at this point: ARMG −2.0 pts, ASTG −2.0 pts, AVL −2.0 pts, AVXX −2.0 pts, BEX −2.0 pts, CIR −2.0 pts, GOOL −2.0 pts, GOOX −2.0 pts, HOOC −2.0 pts, MIC −2.0 pts, MRAX −2.0 pts, NVTX −2.0 pts, ORCX −2.0 pts, PANG −2.0 pts, RXL −2.0 pts, SMCL −2.0 pts, SOFA −2.0 pts, SOFC −2.0 pts, SPCM −2.0 ptsADBU −1.9 pts, and 13 more at this point: AMA −1.9 pts, ASMZ −1.9 pts, COIX −1.9 pts, CSCL −1.9 pts, GLWG −1.9 pts, JBLG −1.9 pts, MVLL −1.9 pts, NVDX −1.9 pts, RAML −1.9 pts, SHPU −1.9 pts, UCO −1.9 pts, USLV −1.9 pts, VIAG −1.9 ptsASMU −1.8 pts, and 13 more at this point: CLSX −1.8 pts, GGLL −1.8 pts, GOGL −1.8 pts, HIMC −1.8 pts, KTUP −1.8 pts, LITG −1.8 pts, LITU −1.8 pts, MCHU −1.8 pts, OKLL −1.8 pts, SNDC −1.8 pts, UGLD −1.8 pts, UPSX −1.8 pts, XSEM −1.8 ptsDIG −1.7 pts, and 14 more at this point: EET −1.7 pts, GEVG −1.7 pts, GLX −1.7 pts, GLXU −1.7 pts, HODU −1.7 pts, INDL −1.7 pts, KEYX −1.7 pts, NFX −1.7 pts, NIOG −1.7 pts, ORCU −1.7 pts, PALU −1.7 pts, PLTU −1.7 pts, SKUU −1.7 pts, SPAL −1.7 ptsARCX −1.6 pts, and 12 more at this point: BAIG −1.6 pts, BIDG −1.6 pts, BOEG −1.6 pts, FOMG −1.6 pts, LRCU −1.6 pts, MXLL −1.6 pts, NFXL −1.6 pts, NVDB −1.6 pts, SNDU −1.6 pts, TPLX −1.6 pts, UMAL −1.6 pts, UYM −1.6 ptsACLZ −1.5 pts, and 17 more at this point: AMZZ −1.5 pts, BIB −1.5 pts, CATG −1.5 pts, CCUP −1.5 pts, ERX −1.5 pts, IONL −1.5 pts, KRWX −1.5 pts, NVC −1.5 pts, NVDL −1.5 pts, OCNL −1.5 pts, ONDG −1.5 pts, PATX −1.5 pts, TERG −1.5 pts, UCC −1.5 pts, UPV −1.5 pts, VRTL −1.5 pts, XPP −1.5 ptsAKAL −1.4 pts, and 14 more at this point: ASTY −1.4 pts, AXTU −1.4 pts, BOEU −1.4 pts, COHH −1.4 pts, DDM −1.4 pts, EFO −1.4 pts, LITX −1.4 pts, MPG −1.4 pts, NVDU −1.4 pts, RKX −1.4 pts, SMU −1.4 pts, UBRL −1.4 pts, UPW −1.4 pts, UYG −1.4 ptsAPLX −1.3 pts, and 25 more at this point: BABU −1.3 pts, BRZU −1.3 pts, CWEB −1.3 pts, EO −1.3 pts, EUVX −1.3 pts, FNG −1.3 pts, GEVC −1.3 pts, IRE −1.3 pts, LABX −1.3 pts, LITC −1.3 pts, LTL −1.3 pts, MSOX −1.3 pts, NBIC −1.3 pts, NUGT −1.3 pts, ORAC −1.3 pts, RGTU −1.3 pts, ROM −1.3 pts, SAA −1.3 pts, SNDG −1.3 pts, SSO −1.3 pts, STXL −1.3 pts, UBR −1.3 pts, UMCX −1.3 pts, URE −1.3 pts, VRC −1.3 ptsACHX −1.2 pts, and 19 more at this point: AXTX −1.2 pts, BABC −1.2 pts, CIEG −1.2 pts, FPSX −1.2 pts, JOBC −1.2 pts, KLAG −1.2 pts, LRCC −1.2 pts, LRNX −1.2 pts, MHX −1.2 pts, MRVU −1.2 pts, ONDU −1.2 pts, ONX −1.2 pts, QLD −1.2 pts, QQXL −1.2 pts, RCAX −1.2 pts, SITX −1.2 pts, UGE −1.2 pts, URSP −1.2 pts, UXI −1.2 ptsAMKX −1.1 pts, and 15 more at this point: ARMA −1.1 pts, BABX −1.1 pts, CRWG −1.1 pts, EZJ −1.1 pts, GUSH −1.1 pts, IREC −1.1 pts, JNUG −1.1 pts, JOBX −1.1 pts, MVV −1.1 pts, OKLC −1.1 pts, OSSL −1.1 pts, SMUP −1.1 pts, SPUU −1.1 pts, TSEG −1.1 pts, WYFL −1.1 ptsCIFU −1.0 pts, and 8 more at this point: COHX −1.0 pts, MRVX −1.0 pts, PLUL −1.0 pts, STLL −1.0 pts, STXU −1.0 pts, UPSC −1.0 pts, UWM −1.0 pts, WDCX −1.0 ptsAGQ −0.9 pts, and 15 more at this point: CIEX −0.9 pts, CIFG −0.9 pts, CPXR −0.9 pts, DLLL −0.9 pts, INTW −0.9 pts, IONC −0.9 pts, NEBX −0.9 pts, NVTC −0.9 pts, QBTX −0.9 pts, SKYU −0.9 pts, TERC −0.9 pts, UBOT −0.9 pts, UNX −0.9 pts, UST −0.9 pts, VELL −0.9 ptsACMM −0.8 pts, and 12 more at this point: ASTX −0.8 pts, CWVX −0.8 pts, EOSU −0.8 pts, FNGG −0.8 pts, IREX −0.8 pts, LEUX −0.8 pts, NBIL −0.8 pts, ONTX −0.8 pts, QNTU −0.8 pts, RGTC −0.8 pts, SIMX −0.8 pts, XQTM −0.8 ptsAAOG −0.7 pts, and 8 more at this point: ALA −0.7 pts, CAMC −0.7 pts, GEVX −0.7 pts, LINT −0.7 pts, NBIG −0.7 pts, UGL −0.7 pts, USAX −0.7 pts, WDCC −0.7 ptsAAOX −0.6 pts, and 14 more at this point: AEHG −0.6 pts, CBRG −0.6 pts, CHAU −0.6 pts, COHC −0.6 pts, CRWU −0.6 pts, CRWX −0.6 pts, CSEX −0.6 pts, IREG −0.6 pts, NOWX −0.6 pts, QUA −0.6 pts, UBT −0.6 pts, UCTX −0.6 pts, USGG −0.6 pts, UUUG −0.6 ptsAXTC −0.5 pts, and 5 more at this point: CBRX −0.5 pts, CRDU −0.5 pts, INT −0.5 pts, STXX −0.5 pts, UUUC −0.5 ptsSMRX −0.4 pts, and 2 more at this point: SNXX −0.4 pts, TTMX −0.4 ptsASTT −0.3 pts, and 2 more at this point: CIFC −0.3 pts, CRD −0.3 ptsXNDX −0.2 ptsOPEX −0.1 ptsRDDC +0.2 ptsAFRU +9.8 ptsTEUP +14.6 ptsHYNX −2.1 ptsHYNX −2.1 pts−41.5 pts+14.6 pts
−41.5 pts to +14.6 pts across 498

That is the share of the 498 leveraged ETFs at 2x, over three months sitting at or below HYNX.

Three months only, against the fund's own daily multiple; a different quarter can rank it very differently. Where the fund sits in this set, not a rating. Do not average it with another category's score.

About HYNX

Of that 8.8, daily compounding is −6.7 points, which any 2 times fund would show over the same path, and the fund itself is −2.1 points against 2 times each day's move, compounded.
Sets out to return+2 times the daily move of SKHY, reset daily
Multiple a holder actually got over the window (ETFIQ)+2.52481 times, against +2 stated
UnderlyingSKHY
Segmentsingle stock, company
Net assets (issuer page, as of Nov 11, 2026)$26mReport
Expense ratio (497 XBRL, Jul 8, 2026)1.25%Report
First tradedJul 14, 2026
Underlying volatility over the window (ETFIQ)75% annualized
How we measure
Read the multiple against the whole window instead and 2 times SKHY's −16.9% implies −33.8%, which makes HYNX look 8.8 points short. That is not the fund's objective, which is daily. HYNX aims to return +2 times SKHY's move each day, then resets. Over one day it does that. Over longer periods the daily results compound, so the total is not +2 times the period's move: it is lower after a fall and recovery, and can be higher in a steady run. SKHY moved at 75% annualized over that window. The more it moves, the further the two numbers separate.
Returns are ETFIQ calculations from Tiingo end-of-day prices, distributions reinvested, measured against the underlying over exactly the same days. Method

Questions people ask about HYNX

Did HYNX return +2 times SKHY?
Over the three months to Nov 12, 2026, SKHY moved −16.9% and HYNX returned −42.6%. 2 times that move is −33.8%, so the fund came out 8.8 points short of it. That is not its objective, which is daily. Against 2 times each day's move, compounded, it was 2.1 points short.
Why does HYNX not return +2 times over a year?
Because it resets daily. HYNX aims at +2 times each day's move, and daily results compound. If the underlying falls and recovers, a holder ends up behind +2 times the period move; in a steady run in one direction, possibly ahead. The longer the holding and the more the underlying swings, the wider the gap.
Which +2x SKHY ETF came closest to its daily multiple?
7 issuers sell one. The table on this page ranks them by how far each finished from 2 times the underlying's move, over the days all of them have traded.
Sources and dates
Prices, HYNX and SKHYTiingo end-of-day prices ↗
Fee, 1.25%497 XBRL · Jul 8, 2026
Net assets, $26mIssuer page · Nov 11, 2026

Links are sources, not endorsements.

Cite this pageCitation, APA and Markdown

ETFIQ, HYNX, leveraged ETFs, data as of Nov 12, 2026. https://etfiq.com/funds/hynx

The label bar for HYNX, redrawn every trading night.

Free to use with attribution for data ETFIQ computes; issuer data stays under its owner's terms. The underlying files are at Open data.

Stated multiple
What the fund sets out to return against its underlying, each day. A fund at 2x aims to return twice the underlying’s daily move, and an inverse fund at -2x aims to return twice it in the opposite direction.
Daily reset
The fund starts each day aiming at the multiple again, from wherever it now stands. It is the mechanism that makes these funds behave as they do, and the reason the stated multiple applies to a day rather than to a holding period.
Compounding
Daily results multiply together rather than adding up. Two days of the multiple is not twice the multiple, and over a run of days the difference between the two grows with how far the underlying moves about.
Decay
What compounding costs a holder when the underlying falls and rises back to where it started. The underlying is level and the fund is down; the more violently it moved, the further down.
Difference against the stated multiple
The fund’s return minus the stated multiple times the underlying’s return, in percentage points. The one number that says whether a holder got what the fund’s own multiple describes.
Embed this chart

Free to use with the credit link. Paste this where the chart should go; it updates every trading night.
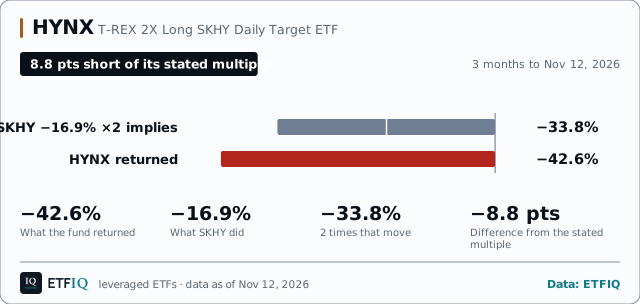
HYNX: HYNX returned −42.6% while 2 times SKHY's move would have been −33.8%. Data from Aug 13, 2026 to Nov 12, 2026.
<figure style="margin:0;max-width:640px">
<iframe src="https://etfiq.com/embed/leverage/hynx/" title="HYNX: HYNX returned −42.6% while 2 times SKHY&#x27;s move would have been −33.8%. Data from Aug 13, 2026 to Nov 12, 2026." width="640" height="334" loading="lazy" style="border:0;max-width:100%;width:100%"></iframe>
<figcaption style="font:13px/1.5 sans-serif">HYNX: HYNX returned −42.6% while 2 times SKHY&#x27;s move would have been −33.8%. Data from Aug 13, 2026 to Nov 12, 2026. Data: <a href="https://etfiq.com/funds/hynx">ETFIQ</a></figcaption>
</figure>

How to embed ETFIQ charts

Get the ETFIQ Daily

The day's ETF flows, a comparison and one number. Every trading morning. About the Daily

The ETFIQ Daily and our other emails. Unsubscribe from any one in a click. See Privacy.

Snapshot, Nov 12, 2026. More on the tabs above.