


DYFI · IDX DYNAMIC FIXED INCOME ETF
Share ▾
Embed ▾
Free to use with the credit link. It updates every trading night.
Fund card
<iframe src="https://etfiq.com/embed/fund/dyfi/" title="ETFIQ DYFI analysis" width="100%" height="420" loading="lazy" style="border:0;max-width:600px"></iframe>
<p>Data: <a href="https://etfiq.com/funds/dyfi">ETFIQ DYFI analysis</a></p>DYFI is actively managed and returned 0.0% over the past year.
- 1-year total return
- 0.0%AGG −1.3% to Nov 12, 2026
- Expense ratio
- 1.13%a year
DYFI returned 0.0% over the year to Nov 12, 2026, charges 1.13% a year and holds $56m in net assets on Jul 31, 2026.
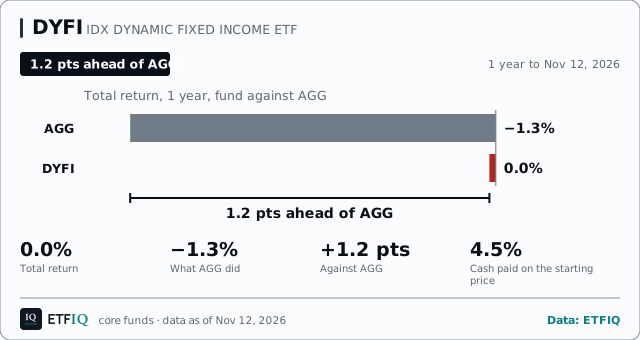
DYFI vs AGG, 1 year
Total return, distributions reinvested, Nov 11, 2025 to Nov 11, 2026.
DYFI risk and return scorecard
vs AGG · Jan 19, 2024 to Nov 5, 2026 · 146 weekly returns · dividend-adjusted
Computed by ETFIQ from Tiingo daily prices and ETFIQ's distribution records; risk-free rate: U.S. Treasury, Daily Treasury Bill Rates, 13-week coupon equivalent Method · Data
What you earned
At DYFI’s 1.13% a year, taken each year from the amount after growth. Hypothetical.
What does it hold, and how long?
8 committee seats read DYFI on data as of Nov 12, 2026: 1 Supports, 0 Mixed, 2 Challenges, 5 without enough data.
- Bogle
- Graham
- Buffett & Munger
- Lynch
- Templeton
- Dalio
- Marks
- Druckenmiller
- Swensen
- Wood
- Livermore
- Skeptic
12 seats on DYFI, as of Nov 12, 2026: 1 Supports, 2 Challenges, 5 Not enough data, 4 Does not apply.
Risk Officer
Risk check
What to look at before you hold DYFI. Not advice.
As of Nov 13, 2026, DYFI crossed 1 of 5 ETFIQ risk lines.
Lines and sources: Method. Check several funds at once on My Portfolio.
More on DYFI
Every number below is on this page. Open what you need.Price and total return, 1 year
$22.16−0.2%1 day, priceClose, Nov 12, 2026
Total return adds every distribution, reinvested. Computed by ETFIQ from Tiingo daily prices.
Source: Tiingo end-of-day prices. Data as of Nov 12, 2026. Updated every trading night. Report a data error
Points (pts) are percentage points.
| Window | Total return | Benchmark (AGG) | Gap to AGG |
|---|---|---|---|
| 1M Oct 13 – Nov 12, 2026 | +0.2% | +0.9% | −0.7 pts |
| 3M Aug 13 – Nov 12, 2026 | −1.1% | −1.5% | +0.4 pts |
| 6M May 14 – Nov 12, 2026 | −0.4% | −1.4% | +1.0 pts |
| YTD Dec 31, 2025 – Nov 12, 2026 | −0.7% | −1.4% | +0.7 pts |
| 1Y Nov 12, 2025 – Nov 12, 2026 | 0.0% | −1.3% | +1.3 pts |
| Since launch Jan 10, 2024 – Nov 12, 2026 | +1.6% | +8.1% | −6.5 pts |
| Since launch, annualised Jan 10, 2024 – Nov 12, 2026 | +0.6% | – | – |
Total returns, distributions reinvested. Listed Jan 2024: no 3 years windows.
Source: Tiingo end-of-day prices, with distributions reinvested.
DYFI key stats
Trading
as of Jan 13, 2026
DYFI for holders outside the US
About DYFI
Questions people ask about DYFI
- How has DYFI performed?
- Over the year to Nov 12, 2026, DYFI returned 0.0% with distributions reinvested, against −1.3% for its benchmark, the Bloomberg US Aggregate Bond Index.
- What does DYFI cost?
- The prospectus expense ratio is 1.13% a year.
- How far is DYFI below its high?
- 1.6% below its high of Feb 23, 2026, measured on the reinvested series to Nov 12, 2026.
Links are sources, not endorsements.
Cite this pageCitation, APA and Markdown
ETFIQ, DYFI, bond fund, data as of Nov 12, 2026. https://etfiq.com/funds/dyfi
ETFIQ. (Nov 12, 2026). DYFI, bond fund. Retrieved from https://etfiq.com/funds/dyfi
[DYFI, bond fund (ETFIQ, Nov 12, 2026)](https://etfiq.com/funds/dyfi)
Free to use with attribution for data ETFIQ computes; issuer data stays under its owner's terms. The underlying files are at Open data.
Embed this chart
Free to use with the credit link. Paste this where the chart should go; it updates every trading night.
<figure style="margin:0;max-width:640px">
<iframe src="https://etfiq.com/embed/core/dyfi/" title="DYFI: DYFI over 1 year: total return 0.0%, its benchmark Bloomberg US Aggregate Bond Index through AGG −1.3%, +1.2 pts. Data to Nov 12, 2026." width="640" height="370" loading="lazy" style="border:0;max-width:100%;width:100%"></iframe>
<figcaption style="font:13px/1.5 sans-serif">DYFI: DYFI over 1 year: total return 0.0%, its benchmark Bloomberg US Aggregate Bond Index through AGG −1.3%, +1.2 pts. Data to Nov 12, 2026. Data: <a href="https://etfiq.com/funds/dyfi">ETFIQ</a></figcaption>
</figure>The day's ETF flows, a comparison and one number. Every trading morning. About the Daily
Snapshot, Nov 12, 2026. More on the tabs above.