ACIO Aptus Collared Investment Opportunity ETF
Hedged equity fund: owns stocks and pays for protection against a fall, most often with put options
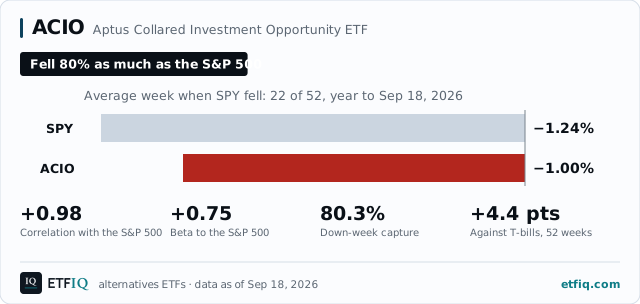
In the S&P 500’s down weeks over the year to Sep 18, 2026, ACIO fell 80% as much as the index.
Key facts
ETFIQ Diversifier Score
9.660th of 63
ACIO’s weekly returns had a correlation of +0.98 with the S&P 500, and in the weeks the index fell its down-week capture was 80.3%. Over the same 52 weeks it finished 4.4 points ahead of T-bills.
How much does it diversify a stock portfolio?
4% of the 63 sit at or above ACIO on this measure.
15.1% of the 63 sit at or above ACIO on this measure.
Weighted evenly, those two positions are what the score combines, across the 63 alternatives ETFs with a full year. Neither spread above is the score: a fund can sit further right on one and score lower. A position in this set, not a rating: it moves when the set moves, and it is not a figure to average against another desk's.
| What it measures | This fund | Its percentile | Weight |
|---|---|---|---|
| correlation with the S&P 500 | +0.98 | 4 | 50% |
| down-week capture against the S&P 500 | 80.3% | 15.1 | 50% |
All alternatives ETFs ranked by this score · How it is computed
Period by period
| Window | The fund | S&P 500 | Difference, percentage points |
|---|---|---|---|
| 3 months | +0.7% | +2.3% | −1.5 pts |
| 6 months | +11.2% | +18.0% | −6.9 pts |
| 1 year | +8.4% | +16.6% | −8.1 pts |
| 3 years | +52.1% | +78.4% | −26.3 pts |
| Since it listed | +98.6% | +183.4% | −84.8 pts |
In plain words
ETFIQ measures what every alternatives fund is sold on: whether it moves differently from the stock market. Over the year to Sep 18, 2026, its weekly returns had a correlation of +0.98 with the S&P 500’s and a beta of +0.75, so for each 1% the index moved it moved about 0.75% the same way. The S&P 500 fell in 22 of those 52 weeks, by 1.24% on average. In the same weeks ACIO fell 1.00% on average, a down-week capture of 80.3%. Over the same 52 weeks ACIO returned +8.1% and a Treasury bill fund +3.6%, so it finished 4.4 percentage points ahead of cash.
| Issuer | Aptus |
|---|---|
| Strategy (ETFIQ, from its prospectus) | Hedged equity |
| Expense ratio (485BPOS XBRL, Aug 26, 2026) | 0.79% |
| Net assets (SEC N-PORT, whole fund, as filed for Apr 30, 2026) | $2.3bn |
| Weeks measured | 52, from Sep 19, 2025 to Sep 18, 2026 |
| Weeks the S&P 500 fell | 22 |
| The S&P 500 in those weeks, on average | −1.24% |
| ACIO in those weeks, on average | −1.00% |
| ACIO total return over those weeks | +8.1% |
| T-bills (BIL) over the same weeks | +3.6% |
| Listed since | Jul 10, 2019 |
| Days traded | 90 |
| Quoted | on an exchange, every trading day |
Weekly closes from Tiingo with distributions reinvested, 52 weeks to the same date for the fund, SPY and BIL. ETFIQ calculation. How these figures are computed
Questions people ask
- Does ACIO move with the S&P 500?
- Over the year to Sep 18, 2026, ACIO’s weekly returns had a correlation of +0.98 with the S&P 500’s, on a scale where 1 moves in step, 0 shows no pattern and −1 moves opposite. Its beta was +0.75, so for each 1% the index moved it moved about 0.75% the same way.
- What did ACIO do when stocks fell?
- The S&P 500 fell in 22 of the 52 weeks to Sep 18, 2026, by 1.24% on average. In those weeks ACIO fell 1.00% on average, a down-week capture of 80.3%.
- Did ACIO earn more than cash?
- Over the same 52 weeks ACIO returned +8.1% with distributions reinvested, and BIL, a fund of Treasury bills, returned +3.6%. ACIO finished 4.4 percentage points ahead of it.
- What does ACIO cost?
- The prospectus expense ratio is 0.79% a year.
- Why is ACIO listed as hedged equity?
- ETFIQ files each fund by what its own prospectus says it does, and ACIO’s, filed Aug 26, 2026, describes a hedged equity fund.
The words on this page
- Correlation
- How closely the fund’s weekly returns moved with the S&P 500’s over the last year, from −1 to 1. At 1 the two rise and fall together, at 0 there is no pattern, and below 0 the fund tended to move the other way.
- Beta
- How far the fund moved, on average, for each 1% move in the S&P 500 over the same weeks. At 0.3 it moved about 0.3% the same way; below 0 it moved the other way.
- Down week
- A week in which the S&P 500 fell, measured through SPY with dividends reinvested. A week that ended exactly level is not a down week.
- Down-week capture
- The fund’s average return in the S&P 500’s down weeks as a share of the index’s own average in those weeks. At 100% it fell as much, at 50% half as much, and below zero it rose. It is weekly and covers one year, so it is not the same figure as Morningstar’s downside capture.
- Against T-bills
- The fund’s total return minus a short Treasury bill fund’s (BIL) over the same year, in percentage points. A fund can steady a portfolio and still earn less than cash.
Every term used here, defined in full on the alternatives ETFs vocabulary page.
Where these figures came from
ETFIQ links to the documents behind every figure. It is not affiliated with any issuer, and a link is not an endorsement.
Compare ACIO
Also against HELO, HEQQ, HEQT, HOLA, KSPY, PHEQ, QBER, QBUL, QCLR, QTR, SHDG, TAIL, THEQ, XCLR, XTR, ZHDG, GLD, IVV, QQQ, SPY, TLT, VOO.
Funds near this one
Put this on your own page
The down-week bars for ACIO, redrawn every trading night. Free to use with the credit link.
Where ACIO is written about
Use this data, or open the live card
Open ACIO live on ETFIQ, where the figures refresh with the data.
Cite this page. ETFIQ, ACIO, alternatives ETFs, data as of Sep 18, 2026. https://etfiq.com/funds/acio Free to use with attribution; the underlying files are at Open data.