

LEXI · Alexis Practical Tactical ETF
Share ▾
LEXI is actively managed and returned +15.5% over the past year.
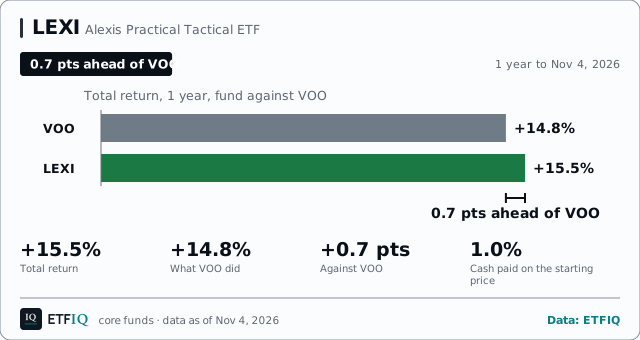
LEXI returned +15.5% over the year to Nov 4, 2026, charges 1.02% a year and holds $191m in net assets on Aug 31, 2026.
Promise check: Not measuredIts name states no stock share or band.
LEXI risk and return scorecard
What you earned
How concentrated, and what does it cost?
No index, actively managedMore on LEXI
Every number below is on this page. Open what you need.Price, 1 year
$40.15+1.0%1 day, priceClose, Nov 4, 2026
Price only. Total return over the same days, distributions reinvested, was +15.5%. Computed by ETFIQ from Tiingo daily prices.
Source: Tiingo end-of-day prices. Data as of Nov 4, 2026. Updated every trading night. Report a data error
Points (pts) are percentage points.
| Window | Total return | Benchmark (VOO) | Gap to VOO |
|---|---|---|---|
| 1M Oct 5 – Nov 4, 2026 | −1.6% | −1.1% | −0.5 pts |
| 3M Aug 5 – Nov 4, 2026 | −2.0% | −0.1% | −1.9 pts |
| 6M May 6 – Nov 4, 2026 | +2.3% | +5.0% | −2.7 pts |
| YTD Dec 31, 2025 – Nov 4, 2026 | +12.8% | +13.4% | −0.6 pts |
| 1Y Nov 4, 2025 – Nov 4, 2026 | +15.5% | +14.8% | +0.7 pts |
| 3Y Nov 3, 2023 – Nov 4, 2026 | +72.0% | +83.3% | −11.3 pts |
| 5Y Nov 5, 2021 – Nov 4, 2026 | +58.1% | +75.5% | −17.4 pts |
| Since launch Jul 1, 2021 – Nov 4, 2026 | +69.4% | +91.6% | −22.2 pts |
| Since launch, annualised Jul 1, 2021 – Nov 4, 2026 | +10.4% | – | – |
Total returns, distributions reinvested.
Source: Tiingo end-of-day prices, with distributions reinvested.
LEXI key stats
Trading
as of Nov 4, 2026
LEXI for holders outside the US
LEXI against the ETFIQ 70 to 85% benchmark
Holdings Aug 31, 2026 · prices Nov 4, 2026LEXI holds 76.0% stocks, which places it in the 70 to 85% band with 12 other allocation ETFs. Its benchmark is ETFIQ Strategic 80. Over the year to Oct 30, 2026 LEXI returned +13.27% against +9.83%, 3.44 points ahead.
Return table
Prices to Nov 4, 2026| Strategic 80 | LEXI listed Jul 1, 2021 | Difference, common period Aug 1, 2021 to Oct 30, 2026 | |
|---|---|---|---|
| 1 year | +9.83%* | +13.27% | 3.44 points ahead |
| Common period, annualised | +7.98%* | +10.03% | 2.05 points ahead |
| 3 years, annualised | +18.58%* | +20.95% | 2.37 points ahead |
| 5 years, annualised | +7.91%* | +9.81% | 1.90 points ahead |
| 10 years, annualised | +10.25%* | not yet: 63 months of history | |
| Volatility, common period | 12.75% | 13.97% | 1.22 pts higher |
| Maximum drawdown, common period | −24.34% (Nov 8, 2021 to Oct 14, 2022) | −22.01% (Jan 4 to Sep 30, 2022) | 2.33 pts shallower |
*Hypothetical for Strategic 80: the window begins before Oct 3, 2026, when ETFIQ froze the rule. The difference needs both numbers. Drawdowns are on daily values, volatility from monthly returns.
Percentile in band
Band 70 to 85% · 13 funds · 3-year return to Oct 30, 2026Calendar years with percentile in band
Band 70 to 85% · 13 funds · years to Dec 31, 2025| Year | LEXI | Benchmark | Band median | Percentile · funds | Band low to high |
|---|---|---|---|---|---|
| 2025* | +19.23% | +19.29% | +11.75% | 85th of 10 · above the median | −0.47%+19.58% |
| 2024* | +16.51% | +13.35% | 9 of the 13 funds in the moderately-aggressive band have a total return in 2024; a percentile needs 10 | ||
| 2023* | +16.58% | +18.65% | 8 of the 13 funds in the moderately-aggressive band have a total return in 2023; a percentile needs 10 | ||
| 2022* | −14.37% | −16.89% | 8 of the 13 funds in the moderately-aggressive band have a total return in 2022; a percentile needs 10 | ||
*Hypothetical: the year begins before Oct 3, 2026, when ETFIQ froze the benchmark's rule. The band is the funds in it today, each measured in the years it existed; a year with fewer than 10 of them has no percentile. LEXI's first close is Jul 1, 2021, so its first whole calendar year is 2022.
Risk by window
Prices to Oct 30, 2026| Measure | 3 years* | 5 years* | 10 years* | |||
|---|---|---|---|---|---|---|
| Portfolio | Benchmark | Portfolio | Benchmark | Portfolio | Benchmark | |
Volatility (annualised) Standard deviation of monthly returns, annualised | 10.69% | 9.90% | 13.98% | 12.83% | not yet: 63 months of history | 12.38% |
Maximum drawdown Largest peak-to-trough fall in the window | −15.94% (Feb 19 to Apr 8, 2025) | −13.18% | −22.01% (Jan 4 to Sep 30, 2022) | −24.34% | not yet: 63 months of history | −28.15% |
Worst month Lowest single calendar-month return | −4.60% (Mar 2026) | −5.32% | −9.18% (Sep 2022) | −8.46% | not yet: 63 months of history | −12.00% |
Sharpe on T-bills Excess return over 3-month T-bills, per unit of volatility | 1.43 | 1.34 | 0.46 | 0.35 | not yet: 63 months of history | 0.65 |
Beta to benchmark Sensitivity to the benchmark’s moves | 1.04 | measured against itself | 1.05 | measured against itself | not yet: 63 months of history | measured against itself |
Up capture Share of benchmark gains kept in up months | 103.87% | measured against itself | 106.26% | measured against itself | not yet: 63 months of history | measured against itself |
Down capture Share of benchmark losses taken in down months | 84.34% | measured against itself | 97.48% | measured against itself | not yet: 63 months of history | measured against itself |
*Hypothetical as a whole: the window begins before Oct 3, 2026. Drawdowns are on daily values; the other measures are from monthly returns. The benchmark measured against itself has no beta or capture.
Costs
Prospectus, Sep 24, 2026| Layer | A year | On $10,000 | Source · date |
|---|---|---|---|
| Fund fee | 1.02% | $102 | 485BPOS XBRL · Sep 24, 2026 |
Every return above is after the fund's fee.
Computed by ETFIQ from Tiingo daily prices. Data sourced by Tiingo.
LEXI top ten by weight, 9.7% of the fund, of its 26 equity positions, from the holdings filed for Aug 31, 2026. Source: the fund’s SEC filing.
Source: Holdings filing (SEC Form N-PORT). Data as of Aug 31, 2026. Updated when the fund files its next report.
About LEXI
12 seats on LEXI, as of Nov 4, 2026: 3 Supports, 1 Mixed, 2 Challenges, 6 Not enough data.
Questions people ask about LEXI
- How has LEXI performed?
- Over the year to Nov 4, 2026, LEXI returned +15.5% with distributions reinvested, against +14.8% for the S&P 500. Over three years the number is +72.0%.
- What does LEXI cost?
- The prospectus expense ratio is 1.02% a year.
- What does LEXI hold?
- 48 positions as filed for Aug 31, 2026, with the top ten at 51.0% of the fund. 18% of its weight is in stocks the S&P 500 also holds.
- How far is LEXI below its high?
- 2.8% below its high of Aug 17, 2026, measured on the reinvested series to Nov 4, 2026.
Links are sources, not endorsements.
Cite this pageCitation, APA and Markdown
ETFIQ, LEXI, allocation fund, data as of Nov 4, 2026. https://etfiq.com/funds/lexi
ETFIQ. (Nov 4, 2026). LEXI, allocation fund. Retrieved from https://etfiq.com/funds/lexi
[LEXI, allocation fund (ETFIQ, Nov 4, 2026)](https://etfiq.com/funds/lexi)
Free to use with attribution for data ETFIQ computes; issuer data stays under its owner's terms. The underlying files are at Open data.
Embed this chart
Free to use with the credit link. Paste this where the chart should go; it updates every trading night.
<figure style="margin:0;max-width:640px">
<iframe src="https://etfiq.com/embed/core/lexi/" title="LEXI: LEXI over 1 year: total return +15.5%, its benchmark S&P 500 Index through VOO +14.8%, +0.7 pts. Data to Nov 4, 2026." width="640" height="370" loading="lazy" style="border:0;max-width:100%;width:100%"></iframe>
<figcaption style="font:13px/1.5 sans-serif">LEXI: LEXI over 1 year: total return +15.5%, its benchmark S&P 500 Index through VOO +14.8%, +0.7 pts. Data to Nov 4, 2026. Data: <a href="https://etfiq.com/funds/lexi">ETFIQ</a></figcaption>
</figure>The day's ETF flows, a comparison and one number. Every trading morning. About the Daily
Snapshot, Nov 4, 2026. More on the tabs above.