

FIVY YieldMax Dorsey Wright Hybrid 5 Income ETF
Share ▾
Closed on Jun 15, 2026. It was liquidated. These are its last numbers, as of the last day it traded. It is not in ETFIQ’s rankings, scores or comparisons.
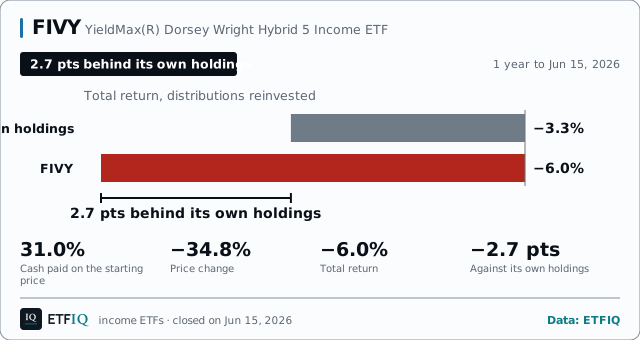
Over the year to Jun 15, 2026, FIVY paid 31.0% in cash and lost 6.0% in total, against −3.3% for its holdings.
FIVY risk and return scorecard
What you earned
What it paid
More on FIVY
Every number below is on this page. Open what you need.Price and total return, 1 year
$24.55+3.4%1 day, priceClose, Jun 15, 2026
Total return adds every distribution, reinvested. Computed by ETFIQ from Tiingo daily prices.
Source: Tiingo end-of-day prices. Data as of Jun 15, 2026. Report a data error
| Window | Total return | Cash paid | Price | its own holdings | Ahead or behind |
|---|---|---|---|---|---|
| 1M | −3.8% | 2.7% | −6.5% | −2.9% | −0.9 pts |
| 3M | +11.0% | 9.1% | +1.6% | +24.3% | −13.3 pts |
| 6M | −5.1% | 15.1% | −20.5% | +3.7% | −8.8 pts |
| YTD | −6.2% | 13.2% | −19.7% | +3.0% | −9.2 pts |
| 1Y | −6.0% | 31.0% | −34.8% | −3.3% | −2.7 pts |
| Since launch | −16.5% | 36.7% | −50.7% | not published | not available |
| Since launch, annualised | −11.4% | – | – | – | – |
Total returns, distributions reinvested. Listed Dec 2024: no 3 years windows.
Source: Tiingo end-of-day prices, with distributions reinvested.
0.0%
0.0%
0.0%
FIVY key stats
FIVY for holders outside the US
About FIVY
How we measure
Questions people ask about FIVY
- How much did FIVY pay in its last year?
- Over the year to Jun 15, 2026, FIVY paid 31.0% of its starting price in cash distributions, while the price fell 34.8%.
- Did FIVY finish ahead of its own holdings?
- Over the year to Jun 15, 2026, with every distribution reinvested, FIVY returned −6.0% against −3.3% for FIVY's own holdings, without the options (from its filed holdings, rebalanced at each filing; latest Apr 30, 2026), so a holder was behind it by 2.7 points.
- How often did FIVY pay, and how much?
- FIVY paid weekly. Its last distribution annualized to 36.9% at its last price, on Jun 15, 2026.
- What did FIVY cost?
- The prospectus expense ratio is 0.70% a year.
Links are sources, not endorsements.
Cite this pageCitation, APA and Markdown
ETFIQ, FIVY, income ETFs, data as of Jun 15, 2026. https://etfiq.com/funds/fivy
ETFIQ. (Jun 15, 2026). FIVY, income ETFs. Retrieved from https://etfiq.com/funds/fivy
[FIVY, income ETFs (ETFIQ, Jun 15, 2026)](https://etfiq.com/funds/fivy)
The payout bar for FIVY, redrawn every trading night.
Free to use with attribution for data ETFIQ computes; issuer data stays under its owner's terms. The underlying files are at Open data.
Embed this chart
Free to use with the credit link. Paste this where the chart should go; it updates every trading night.
<figure style="margin:0;max-width:640px">
<iframe src="https://etfiq.com/embed/income/fivy/" title="FIVY: FIVY over 1 year: paid 31.0%, price −34.8%, total −6.0%, its own holdings −3.3%, −2.7 pts. Data to Jun 15, 2026." width="640" height="370" loading="lazy" style="border:0;max-width:100%;width:100%"></iframe>
<figcaption style="font:13px/1.5 sans-serif">FIVY: FIVY over 1 year: paid 31.0%, price −34.8%, total −6.0%, its own holdings −3.3%, −2.7 pts. Data to Jun 15, 2026. Data: <a href="https://etfiq.com/funds/fivy">ETFIQ</a></figcaption>
</figure>The day's ETF flows, a comparison and one number. Every trading morning. About the Daily
Snapshot, Jun 15, 2026. More on the tabs above.