
INFR ClearBridge Sustainable Infrastructure ETF

Share ▾
Share on XDownload as PDF

Closed on Jan 22, 2026. It was liquidated. These are its last numbers, as of the last day it traded. It is not in ETFIQ’s rankings, scores or comparisons.

$27.74
−0.1% · 1 day, price
IQ’s readingComputed nightly from ETFIQ data. Not written live.

Over the year to Jan 22, 2026, INFR returned 28.6%.

Held 29 stocks in infrastructure, 18% of its weight in S&P 500 companiesClearBridge Expense ratio 0.59%First traded Dec 16, 2022Benchmark Its own holdings, as of Dec 31, 2025; its prospectus compares it with the MSCI All Country World Index-NR, but its daily returns fit ACWI's at R-squared 0.0364 over the year to Nov 4, 2026 (239 days), under the 0.35 it needs to return to itSEC filings ↗

INFR risk and return scorecard

vs ACWI, its stated benchmark (secondary) · Dec 2022 to Oct 2026 · 200 weekly returns · dividend-adjusted

3.9 years
INFR +23.2%, ACWI +94.7%, Dec 2022 to Oct 2026, distributions reinvested.

Secondary: ACWI tracks the MSCI All Country World Index-NR, named in its prospectus. Its own benchmark is its holdings, which have no weekly prices.

Return
MeasureINFRACWIEdge
Total return+23.2%+94.7%ACWI
Annualized+5.6%+18.9%ACWI
Price return+13.8%+83.4%ACWI
Risk
MeasureINFRACWIEdge
Volatility12.5%13.5%INFR (slight)
Max drawdown−18.2%−14.3%ACWI
Upside capture30.4%100.0%ACWI
Downside capture53.0%100.0%INFR
Risk-adjusted
MeasureINFRACWIEdge
Sharpe ratio0.131.01ACWI
Sortino ratio0.181.52ACWI
Alpha vs ACWI
MeasureINFRACWIEdge
Alpha, a year−4.1%Not significant
Alpha t-stat−0.70
Beta to ACWI0.411.00Lower beta

Computed by ETFIQ from Tiingo daily prices and ETFIQ's distribution records; risk-free rate: U.S. Treasury, Daily Treasury Bill Rates, 13-week coupon equivalent Method · Data

What you earned

INFR +1.6%: total return over one month to Jan 22, 2026.
INFR+1.6%
INFR +1.7%: total return over three months to Jan 22, 2026.
INFR+1.7%
INFR +4.9%: total return over six months to Jan 22, 2026.
INFR+4.9%
INFR +1.4%: total return over the year to Jan 22, 2026.
INFR+1.4%
INFR +28.6%: total return over one year to Jan 22, 2026.
INFR+28.6%
INFR +18.5%: total return over three years to Jan 22, 2026.
INFR+18.5%
INFR +23.8%: total return since launch to Jan 22, 2026.
INFR+23.8%

What did you actually buy?

Infrastructure · holdings as of Dec 31, 2025
18.2%
Already in the S&P 500
99.3%
Active share vs the S&P 500
46.5%
Top ten holdings
+28.6%
Total return, 1 year
3.1%
12-month yield, capital gains included, on its starting price
$0.4755
Last payment (paid annually), ex-date Dec 19, 2025
Share already in the S&P 500
18.2% of the fund by weight, holdings as of Dec 31, 2025.
Ten largest holdings

More on INFR

Every number below is on this page. Open what you need.

The week's ETF fund flows, by email on Sundays.

One-click unsubscribe. See Privacy.

Price, 1 year

$27.74−0.1%1 day, priceClose, Jan 22, 2026

Price only. Total return over the same days, distributions reinvested, was +28.6%. Computed by ETFIQ from Tiingo daily prices.

Source: Tiingo end-of-day prices. Data as of Jan 22, 2026. Report a data error

Points (pts) are percentage points.

INFR returns by window: total return, cash paid and price change
WindowTotal returnS&P 500 (SPY)
1M +1.6%+0.1%
3M +1.7%+2.9%
6M +4.9%+9.2%
YTD +1.4%+1.0%
1Y +28.6%+14.9%
3Y +18.5%+78.9%
Since launch +23.8%+87.0%
Since launch, annualised +7.1%–

Total returns, distributions reinvested.

Source: Tiingo end-of-day prices, with distributions reinvested.

INFR key stats

52-week high, daily closes to Jan 22, 2026 (ETFIQ)$28.07 on Nov 28, 2025
52-week low, daily closes to Jan 22, 2026 (ETFIQ)$22.17 on Jan 24, 2025
Close on Jan 22, 2026, within that range (ETFIQ)$27.74, 94% of the way from the low to the high
Holdings29
Top ten holdings weight46.5%
Range, beta and R-squared computed by ETFIQ from Tiingo daily prices.

INFR for holders outside the US

US tax withheld on dividends, no treaty30%
Treaty rates on dividends (IRS table, read Oct 30, 2026)65 countries, 10% to 30%
INFR interest-related and short-term gain dividendsnot read by ETFIQ
US estate tax filing threshold, non-resident holders$60,000
Share classDistributing

INFR is a US fund. Stock of US corporations counts as US property for a non-resident's estate. Facts from the IRS, not tax advice. How withholding and treaties work

INFR top ten by weight, 46.5% of the fund, of its 29 equity positions, from the holdings filed for Dec 31, 2025. Source: the fund’s SEC filing.

SSE PLC SSE 6.12%
Ferrovial SE FER 5.12%
Enav SpA ENAV 4.67%
Getlink SE GET 4.62%
Enel SpA ENEL 4.08%
Vinci SA DG 3.83%

Source: Holdings filing (SEC Form N-PORT). Data as of Dec 31, 2025.

About INFR

Theme (ETFIQ, editorial)Infrastructure
First tradedDec 16, 2022
Already in the S&P 500, by weight (ETFIQ)18.2%
Outside the S&P 500, by weight (ETFIQ)82%
Active share vs the S&P 500 (ETFIQ)99.3%
Already in the Nasdaq-100, by weight (ETFIQ)11.6%
Active share vs the Nasdaq-100 (ETFIQ)99.2%
Top ten holdings weight46.5%
Holdings29
Holdings as of (SEC N-PORT)Dec 31, 2025
Top holdingsSSE PLC 6.1%, Severn Trent PLC 5.5%, Ferrovial SE 5.1%, Enav SpA 4.7%, Getlink SE 4.6%, NextEra Energy Inc 4.5%, Pennon Group PLC 4.1%, Enel SpA 4.1%, Cellnex Telecom SA 4.0%, Vinci SA 3.8%
Benchmark (ETFIQ, from its filings)Its own holdings, as of Dec 31, 2025; its prospectus compares it with the MSCI All Country World Index-NR, but its daily returns fit ACWI's at R-squared 0.0364 over the year to Nov 4, 2026 (239 days), under the 0.35 it needs to return to it
Stated benchmark (secondary)MSCI All Country World Index-NR (from its prospectus), priced by ACWI
INFR, 1 year to Jan 22, 2026 (secondary)+28.6%
ACWI, the same days (secondary)+21.3%
Against its stated benchmark, 1 year (secondary)+7.3 pts
Daily R-squared against ACWI, 1 year to Nov 4, 2026 (secondary)0.04
Below its all-time high (ETFIQ)−0.7%
Expense ratio (485BPOS XBRL, Jul 28, 2025)0.59%Report
Fee for the part that differed from the S&P 500, active expense ratio (ETFIQ)0.59%
How we measure
Holdings from the fund’s latest public SEC N-PORT filing; overlap and active share computed by ETFIQ against the IVV and QQQM books; returns from Tiingo end-of-day prices with distributions reinvested. Method

Questions people ask about INFR

How much of INFR was in S&P 500 companies?
By its holdings filed for Dec 31, 2025, 18% of INFR by weight was stocks the S&P 500 held. Its active share against the index was 99%, so that share was the part doing something different.
What did INFR hold?
29 positions as filed for Dec 31, 2025, with the top ten at 46% of the fund. The largest were SSE PLC at 6.1%, Severn Trent PLC at 5.5%, Ferrovial SE at 5.1%.
Did INFR beat the S&P 500?
Over the year to Jan 22, 2026 INFR returned +28.6% with distributions reinvested, against +14.9% for the S&P 500, so it finished ahead of the index by 13.7 points.
What did INFR cost?
The prospectus expense ratio is 0.59% a year. Because 99% of the fund differed from the S&P 500, the fee on that differing part worked out at 0.59%.
Sources and dates
Prices, INFR and S&P 500 (SPY)Tiingo end-of-day · Jan 22, 2026

Links are sources, not endorsements.

Cite this pageCitation, APA and Markdown

ETFIQ, INFR, thematic ETFs, data as of Jan 22, 2026. https://etfiq.com/funds/infr

The difference bar for INFR, redrawn every trading night.

Free to use with attribution for data ETFIQ computes; issuer data stays under its owner's terms. The underlying files are at Open data.

How differently the money is placed, counting weights: one minus the sum of the smaller weight of each security across the fund and the index. 100% means nothing in common; 0% means the index itself. Two funds can hold the same names and still have a high active share if they weight them very differently.
Weight overlap
The share of money two portfolios hold in the same securities at the same weight.
Already in the index
The fund’s weight in securities the S&P 500 holds at all. A fund can be made entirely of index names and still have high active share, because it holds them at different weights.
The weight of the ten largest holdings. Above 50% the fund is a bet on a handful of companies, whatever the theme.
Embed this chart

Free to use with the credit link. Paste this where the chart should go; it updates every trading night.
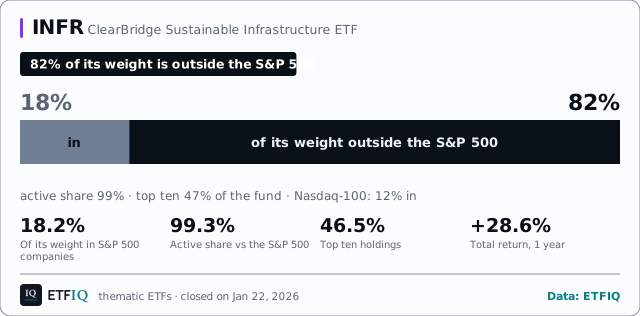
INFR: 18% of INFR's weight is in S&P 500 companies and 82% is outside the index. Holdings as of Dec 31, 2025.
<figure style="margin:0;max-width:640px">
<iframe src="https://etfiq.com/embed/themes/infr/" title="INFR: 18% of INFR&#x27;s weight is in S&amp;P 500 companies and 82% is outside the index. Holdings as of Dec 31, 2025." width="640" height="346" loading="lazy" style="border:0;max-width:100%;width:100%"></iframe>
<figcaption style="font:13px/1.5 sans-serif">INFR: 18% of INFR&#x27;s weight is in S&amp;P 500 companies and 82% is outside the index. Holdings as of Dec 31, 2025. Data: <a href="https://etfiq.com/funds/infr">ETFIQ</a></figcaption>
</figure>

How to embed ETFIQ charts

Get the ETFIQ Daily

The day's ETF flows, a comparison and one number. Every trading morning. About the Daily

The ETFIQ Daily and our other emails. Unsubscribe from any one in a click. See Privacy.

Snapshot, Jan 22, 2026. More on the tabs above.