Closed on Jun 30, 2026.The exchange no longer lists it. These are its last figures, as of the last day it traded. It is not in ETFIQ’s rankings, scores or comparisons.
Covered call on EtherGrayscale0.66% feePaid not establishedFirst traded Jun 10, 2026SEC filings ↗
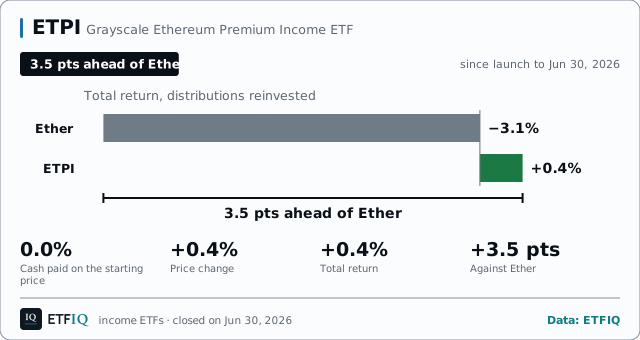
Since launch in Jun 2026, ETPI paid no cash and returned 0.4% in total, against −3.1% for Ether.
Price only. No distribution was paid over these days, so total return is the same. Computed by ETFIQ from Tiingo daily prices.
Source: Tiingo end-of-day prices. Data as of Jun 30, 2026. Report a data error
Where the return came from
ETPI
+0.4%
Ether
−3.1%
3.5 pts ahead of Ether ETPI since launch: paid 0.0%, price +0.4%, total +0.4%, Ether −3.1%, +3.5 pts. Figures to Jun 30, 2026. Ether −3.1% ETPI +0.4% 3.5 pts ahead of Ether Total return, distributions reinvested 3.5 pts ahead of Ether ETPI since launch: paid 0.0%, price +0.4%, total +0.4%, Ether −3.1%, +3.5 pts. Figures to Jun 30, 2026. Ether −3.1% ETPI +0.4% 3.5 pts ahead of Ether From launch to Jun 30, 2026, ETPI returned +0.4% with distributions reinvested and Ether (ETH-USD) returned −3.1%, so a holder came out ahead of it by 3.5 points. The lighter segment is the 0.0% that arrived as cash rather than as price.
Price change +0.4%Cash paid 0.0%, reinvested+3.5 pts vs Ether
ETPI returns by window: total return, cash paid and price change
Window
Total return
Cash paid
Price
Ether
Ahead or behind
Since launch
+0.4%
0.0%
+0.4%
−3.1%
+3.5 pts
Total return at closing prices, distributions reinvested. Not shown: 1 month, 3 months, 6 months, year to date, 1 year and 3 years, which the fund has not been listed long enough to fill (listed Jun 2026); its since-launch row covers all of its record. Source: ETFIQ.
Source: Tiingo end-of-day prices, with distributions reinvested. Data as of Jun 30, 2026. Report a data error
ETPI key stats
High since Jun 10, 2026, daily closes to Jun 30, 2026 (ETFIQ)$11.48 on Jun 29, 2026
Low since Jun 10, 2026, daily closes to Jun 30, 2026 (ETFIQ)$11.37 on Jun 16, 2026
Close on Jun 30, 2026, within that range (ETFIQ)$11.46, 82% of the way from the low to the high
Range, beta and R-squared computed by ETFIQ from Tiingo daily prices.
How the benchmark is set (ETFIQ)Its prospectus says it is built on Ether (prospectus, Form 485BPOS, accession 0001213900-26-050155, filed 2026-04-30).
Paidnot established
Last payout, annualized (ETFIQ)not published
Expense ratio (485BPOS XBRL, Apr 30, 2026)0.66%Report
Cash paid, since launch, Jun 10, 2026, over its last price (ETFIQ)0.0%
First tradedJun 10, 2026
How we measure
Every figure is an ETFIQ calculation from exchange prices and cash distributions (Tiingo end-of-day), total return with distributions reinvested. Return of capital is the issuer’s estimate. How these figures are computed
Questions people ask about ETPI
▾
How much did ETPI pay over its life?
Over the period from its first trade on Jun 10, 2026 to Jun 30, 2026, ETPI paid 0.0% of its starting price in cash distributions, while the price rose 0.4%.
Did ETPI finish ahead of Ether?
Over the period from its first trade on Jun 10, 2026 to Jun 30, 2026, with every distribution reinvested, ETPI returned +0.4% against −3.1% for Ether (ETH-USD), so a holder was ahead of it by 3.5 points.
What did ETPI cost?
The prospectus expense ratio is 0.66% a year.
Sources and dates
Prices, ETPI and EtherTiingo end-of-day · Jun 30, 2026
Price change plus every distribution reinvested on the day it went ex-dividend. This is what you actually ended up with, and the only fair basis for comparing with an index.
Cash paid
Distributions over the window as a share of what the fund cost at the start. A measure of cash delivered, not of return: a fund can pay a great deal and still lose money.
Total return minus benchmark total return, in percentage points. A fund can pay 12% a year and still be behind by 10 points if its price fell while the index rose.
Return of capital
The issuer’s own estimate, in a Rule 19a-1 notice, of how much of a distribution was your own money returned. An estimate and a tax characterization, not a measure of erosion.
The fund owns the stocks and sells call options on them, collecting premium and giving up gains above the strike. Synthetic covered call funds hold options instead of the stocks. 0DTE funds sell options that expire the same day.
A fund that pays a coupon and can be called away early, on dates set when it launched. If it is called, you get your money back with the coupon and the run ends. If it is not, it runs on to the next date.
The level the underlying has to stay above for you to be repaid in full. A barrier is not a buffer. A buffer takes the first slice of a fall for you; a barrier takes none of it once it breaks, so below it you take the whole fall rather than only the part past it.
Four ranked ETF lists in one email every Friday morning. The last note
ETPI, Income ETFs, ETFIQ, data as of Jun 30, 2026. Every figure is calculated from a named public source; the method is at etfiq.com/methodology. ETFIQ is an independent publisher, is not a fund issuer, broker-dealer or investment adviser, and makes no recommendations.