Get the weekly note
ETFIQetfiq.com · independent ETF data

QQJL Corgi Growth & Technology 15% Structured Buffer ETF - July Series

Absorbs the first 15% of loss on QQQ and caps the gain at 20.1%, over a period ending Jun 30, 2027

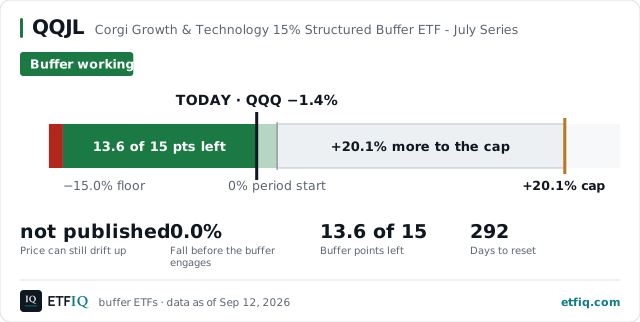
As of Sep 11, 2026, QQJL's buffer is absorbing losses, with 13.6% of 15.0% points still beneath QQQ.

Corgi · Buffer ETFs · data as of

Key facts

not publishedCan still gain
0.0%Fall before the buffer
13.6%Protection left, index points
292Days to reset

Method

ETFIQ Downside Cover Score

70.587th of 293

QQJL absorbs 68% of the next 20% fall in what it tracks.

If the market falls into a bear market from here, how much does the buffer absorb?

Share of a 20% fall the buffer absorbs
QBKV 5.7%QBQV 10.4%TBJL 12.9%PQV 25.0%QBIV 25.0%QBSV 25.0%TSEP 25.7%DSEP 26.2%TMAR 27.7%DNOV 28.3%QSPT 28.3%DOCT 28.8%TJUN 29.1%UOCT 29.1%KOCT 30.8%RBUF 30.8%QJN 31.3%SNOV 32.1%TDEC 32.1%QJUN 32.6%UNOV 32.6%PQOC 33.9%EOCT 34.9%QBUF 35.4%KNOV 35.9%UDEC 36.1%FHDG 36.5%DMAR 36.9%DDEC 37.2%BOCT 39.0%QMAR 39.3%NOCT 39.5%QMNV 39.5%OCTT 39.7%FSEP 39.9%ARLU 40.0%RSSE 40.4%UAPR 40.5%FNOV 40.7%STEN 41.0%UJAN 41.1%APRZ 41.5%FOCT 41.5%DJAN 42.2%KDEC 42.4%YSEP 42.5%INOV 42.6%IOCT 42.9%QJL 42.9%EAPR 43.0%BSEP 43.2%DFEB 43.9%PQAP 44.1%QDEC 44.4%OCTP 44.6%BAPR 45.0%BAUG 45.0%BDEC 45.0%BFEB 45.0%BJAN 45.0%BJUL 45.0%BJUN 45.0%BMAR 45.0%BMAY 45.0%BNOV 45.0%UMAR 45.1%PQJL 45.4%UFEB 45.5%EBUF 45.9%KJAN 46.1%NNOV 46.5%NVBT 47.0%TEND 47.5%TENJ 47.5%TENM 47.5%SEPZ 47.9%IDEC 48.0%SEPT 48.2%SIXP 48.2%FMAR 48.4%GSEP 48.6%QCOC 48.7%FAUG 49.0%KAPR 49.0%POCT 49.0%PQJA 49.1%APRT 49.2%DECT 49.3%NDEC 49.3%NOVP 49.4%GNOV 49.8%AUGC 50.0%AUGT 50.0%AUGZ 50.0%BGLD 50.0%EALT 50.0%FAPR 50.0%FDEC 50.0%FEBT 50.0%FEBZ 50.0%FFEB 50.0%FJAN 50.0%FJUL 50.0%FJUN 50.0%FMAY 50.0%GOCT 50.0%IBUF 50.0%JANT 50.0%JANZ 50.0%JULC 50.0%JULT 50.0%JULZ 50.0%JUNC 50.0%JUNT 50.0%JUNZ 50.0%MART 50.0%MARZ 50.0%MAYC 50.0%MAYT 50.0%MAYZ 50.0%NOVZ 50.0%OCTZ 50.0%PQX 50.0%QAU 50.0%QMY 50.0%RSDE 50.0%RSJN 50.0%RSMR 50.0%SIXD 50.0%SIXF 50.0%SIXJ 50.0%SIXO 50.0%SIXZ 50.0%ZALT 50.0%OCTU 50.2%NAPR 50.9%EJAN 51.8%DAPR 52.0%PNOV 52.4%APRP 52.5%DECP 52.9%NJAN 54.5%OCTW 54.6%PBOC 54.6%YMAR 55.1%KJUL 55.8%QBKF 55.8%NMAR 56.0%QMFE 56.0%PDEC 56.1%QQJN 56.3%SAUG 56.5%GMAR 56.6%NVBW 56.8%UMAY 56.8%PBNV 57.0%JANP 57.5%JANU 57.6%SCJL 57.6%NFEB 58.0%SEPP 58.2%YDEC 58.2%KFEB 58.3%MARU 58.9%EMJN 59.0%NJUN 59.1%DMAY 59.4%DECU 59.6%GDEC 59.6%AUGP 60.0%DECW 60.0%FEBP 60.0%JULP 60.0%JUNP 60.0%MAYP 60.0%MRCP 60.0%NVBU 60.1%IJAN 60.3%NJUL 60.4%PAPR 60.4%QBQF 60.4%KMAR 61.0%PBDE 61.1%PJAN 61.5%SFEB 62.4%DHDG 62.5%QCJA 62.5%SCAU 62.6%FEBU 62.8%SQMX 63.1%DJUL 63.2%DJUN 63.4%IAPR 63.4%PBAP 63.6%APRW 64.8%GJAN 64.8%JANW 65.0%PFEB 66.0%ARLI 66.2%PMAR 66.2%GFEB 66.3%PBJA 66.3%KSEP 66.5%QQMY 67.0%SEPM 67.0%UJUL 67.2%UJUN 68.5%UAUG 68.8%FEBW 68.9%OCTM 69.3%PBFB 69.6%MARW 69.7%CMAY 70.2%PBMR 70.3%EJUL 70.8%KAUG 71.0%DAUG 71.3%ISEP 71.5%NOVM 71.8%KJUN 72.3%PSEP 73.2%QCAP 73.2%SEPU 73.2%CTMA 73.5%NSEP 73.7%EMAU 74.0%GAUG 74.0%IFEB 74.0%SQBA 74.0%GAPR 74.5%SCJN 74.9%AUGU 75.0%CAUG 75.0%CJUL 75.0%CJUN 75.0%EMJL 75.0%EMMY 75.0%GJUL 75.0%GJUN 75.0%GMAY 75.0%IAUG 75.0%IDAU 75.0%IDJL 75.0%IDJN 75.0%IDMY 75.0%IJUL 75.0%IJUN 75.0%IMAR 75.0%IMAY 75.0%JANI 75.0%JNEU 75.0%JULI 75.0%JULU 75.0%KMAY 75.0%MAYU 75.0%NAUG 75.0%NMAY 75.0%PAUG 75.0%PJUL 75.0%PJUN 75.0%PMAY 75.0%PQXV 75.0%QBIF 75.0%QBSF 75.0%QMAG 75.0%QMMY 75.0%QQAU 75.0%SCMY 75.0%SMAY 75.0%YJUN 75.0%DECM 75.1%USEP 75.5%JANM 78.0%MAYW 79.2%MARM 79.4%FEBM 80.0%PBMY 80.4%QCJL 85.0%APXM 85.3%CTJL 87.8%JULW 88.5%JUNW 89.3%PBJL 89.4%AUGW 90.2%PBJN 90.7%PBAU 91.3%PQXX 91.8%BALT 92.0%CTAU 95.7%CTJN 96.3%SEPW 96.4%PBSE 98.0%QQJL 67.8%QQJL 67.8%5.7%98.0%

That is the share of the 293 buffer ETFs with a live outcome period sitting at or below QQJL. A position in this set, not a rating: it moves when the set moves, and it is not a figure to average against another desk's.

All buffer ETFs ranked by this score · How it is computed

351st of 380 buffer ETFs by net assets 303rd of 380 buffer ETFs by how soon they reset

QQJLBuffer working
13.6 of 15 pts of buffer left+20.1% more to the cap−15.0% floor0% period start+20.1% capTODAY · QQQ −1.4%13.6 pts+20.1% to cap−15.0% floor0% start+20.1% capTODAY · QQQ −1.4%

Method

In plain words

292 days remained on Sep 11, 2026. On Jun 30, 2027 the period ends and a new cap is set.

QQJL (Corgi Growth & Technology 15% Structured Buffer ETF - July Series), buffer ETFs fields as of Sep 11, 2026. Source: ETFIQ.
Reference indexQQQ
Buffer15%
Outcome periodJul 1, 2026 to Jun 30, 2027
Starting cap+20.1%
QQQ return since period start−1.4%
Fund return since period start+0.9%
Net assets (issuer page, as of Sep 11, 2026)$1m
Band state today (ETFIQ)Buffer working
Can still gain (issuer, fund price)not published
Fall before buffer (issuer, fund price)0.0%
Fall to the buffer in index terms (ETFIQ)0.0%
Protection left in index points (ETFIQ)13.6% of 15.0%
Days left in period292
Expense ratio (issuer page, Sep 11, 2026)0.30%

Issuer-published figures as of the date shown; ETFIQ calculations marked. Definitions on the learn page. How these figures are computed

Questions people ask

How far can QQJL fall before the buffer helps?
0.0% in fund-price terms on Sep 11, 2026, by the issuer's figure. In index terms QQQ can fall 0.0% from that level before the buffer begins. Losses until that point are the holder's.
How much of the QQJL buffer is left?
13.6% of the 15.0% buffer sat below the QQQ level on Sep 11, 2026. That is an ETFIQ calculation in index points, on one definition for every issuer.
When does QQJL reset?
The outcome period ends on Jun 30, 2027, 292 days from the data on Sep 11, 2026. A new cap is set the next day and the buffer starts again.
What does QQJL cost?
The prospectus expense ratio is 0.30% a year.

The words on this page

Buffer
The first slice of loss the fund absorbs for you over its outcome period, stated on the reference index. A 15% buffer means the index can fall 15% before you take any of it.
Cap
The most the fund can return over the period, however far the index rises. It is the price paid for the buffer.
Outcome period
The window the buffer and cap apply over, usually a year. Both are set at the start and only hold if you are there for the whole of it.
Reset
The day one outcome period ends and the next begins, with a fresh buffer and a fresh cap struck at that day’s level.
Protection left
The part of the buffer still below today’s index level. A buffer bought mid-period is not the full buffer; this is what is left of it.

Every term used here, defined in full on the buffer ETFs vocabulary page.

Where these figures came from

ETFIQ links to the documents behind every figure. It is not affiliated with any issuer, and a link is not an endorsement.

Compare QQJL

Funds near this one

Put this on your own page

The outcome band for QQJL, redrawn every trading night. Free to use with the credit link.

QQJL outcome band, ETFIQ

Copy the embed code
<a href="https://etfiq.com/funds/QQJL"><img src="https://etfiq.com/embed/buffer/QQJL.svg" alt="QQJL outcome band, ETFIQ" width="640"></a>
<p><a href="https://etfiq.com/funds/QQJL">QQJL outcome band, updated daily by ETFIQ</a></p>

Where QQJL is written about

QQJL, Buffer ETFs, ETFIQ, data as of Sep 11, 2026. Every figure is arithmetic on a named public source; the method is at etfiq.com/methodology. ETFIQ is an independent publisher, is not a fund issuer, broker-dealer or investment adviser, and makes no recommendations.
Use this data, or open the live card

Open QQJL live on ETFIQ, where the figures refresh with the data.

Cite this page. ETFIQ, QQJL, buffer ETFs, data as of Sep 11, 2026. https://etfiq.com/funds/QQJL Free to use with attribution; the underlying files are at Open data.
How these figures are computed · Standards and sources