Data as of . Issuer-published figures as of the date shown; ETFIQ calculations marked. Definitions on the learn page.
TMAR · FT Vest Emerging Markets Buffer ETF - March
First Trust · Buffer desk
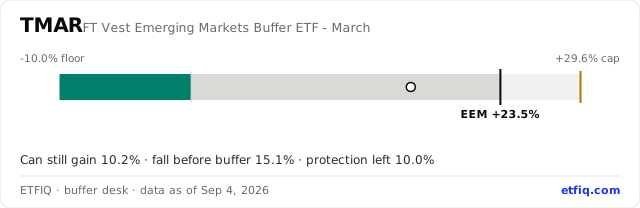
Open the live card on ETFIQFrom its price on Sep 4, 2026, the fund can gain about 10.2% more before it reaches its cap. The fund's price can fall 15.1% from here before the buffer starts absorbing losses, by the issuer's figure. In index terms, EEM can fall 19.0% from today's level to the point where the buffer begins. Protection left, in index points: 10.0% of the 10.0% buffer still sits below today's EEM level. 196 days remained on Sep 4, 2026. On Mar 19, 2027 the period ends and a new cap is set.
| Reference index | EEM |
|---|---|
| Buffer | |
| Outcome period | Mar 23, 2026 to Mar 19, 2027 |
| Starting cap | +29.6% |
| EEM return since period start | +23.5% |
| Fund return since period start | +16.7% |
| Band state today (ETFIQ) | Open |
| Can still gain (issuer, fund price) | 10.2% |
| Fall before buffer (issuer, fund price) | 15.1% |
| Fall to the buffer in index terms (ETFIQ) | 19.0% |
| Protection left in index points (ETFIQ) | 10.0% of 10.0% |
| Days left in period | 196 |
| Expense ratio | 0.95% |
Questions people ask
- How much can TMAR still gain?
- About 10.2% from its price on Sep 4, 2026, before it reaches its cap, by the issuer's published figure. The cap for the period was set at +29.6%.
- How far can TMAR fall before the buffer helps?
- 15.1% in fund-price terms on Sep 4, 2026, by the issuer's figure. In index terms EEM can fall 19.0% from that level before the buffer begins. Losses until that point are the holder's.
- How much of the TMAR buffer is left?
- 10.0% of the 10.0% buffer sat below the EEM level on Sep 4, 2026. That is an ETFIQ calculation in index points, on one definition for every issuer.
- When does TMAR reset?
- The outcome period ends on Mar 19, 2027, 196 days from the data on Sep 4, 2026. A new cap is set the next day and the buffer starts again.
- What does TMAR cost?
- The prospectus expense ratio is 0.95% a year.
Where these figures came from
ETFIQ links to the documents behind every figure. It is not affiliated with any issuer, and a link is not an endorsement.
Funds near this one
Put this on your own page
The outcome band for TMAR, redrawn every trading night. Free to use with the credit link; paste these two lines into any page or newsletter.
<a href="https://etfiq.com/funds/TMAR.html"><img src="https://etfiq.com/embed/buffer/TMAR.svg" alt="TMAR outcome band, ETFIQ" width="640"></a>
<p><a href="https://etfiq.com/funds/TMAR.html">TMAR outcome band, updated daily by ETFIQ</a></p>
Cite this page. ETFIQ, TMAR on the buffer desk, data as of Sep 4, 2026. https://etfiq.com/funds/TMAR.html Free to use with attribution; the underlying files are at Open data.
ETFIQ is an independent publisher of exchange-traded fund data. It is not a fund issuer, broker-dealer or investment adviser, and it makes no recommendations; sort orders and figures are stated arithmetic on published data. Standards · How to read this desk