IWMW · iShares Russell 2000 BuyWrite ETF
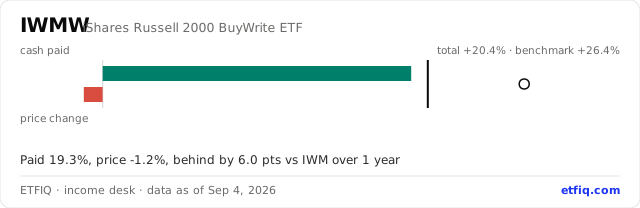
Over the past year IWMW paid 19.3% in cash and still finished 6.0 points behind IWM.
What a holder got
Over the year to Sep 4, 2026, IWMW returned +20.4% with distributions reinvested and Russell 2000 (IWM) returned +26.4%, so a holder came out behind it by 6.0 points. The lighter segment is the 19.3% that arrived as cash rather than as price.
Period by period
| Window | Cash paid | Price | Total return | IWM | Ahead or behind |
|---|---|---|---|---|---|
| 3 months | 3.7% | +4.7% | +8.5% | +5.3% | +3.2 pts |
| 6 months | 9.5% | +5.5% | +15.6% | +18.5% | −2.8 pts |
| 1 year | 19.3% | −1.2% | +20.4% | +26.4% | −6.0 pts |
| Since launch | 42.5% | −19.4% | +32.8% | +50.3% | −17.5 pts |
In plain words
With every distribution reinvested, the fund returned +20.4%. Russell 2000 (IWM) returned +26.4% over the same days, so a holder was behind by 6.0 pts. At its price on Sep 4, 2026 the latest distribution annualises to 7.1%, paid monthly.
| Strategy | covered call |
|---|---|
| Benchmark | Russell 2000 (IWM) |
| Pays | monthly |
| Net assets (SEC filing, whole fund, as filed for Apr 30, 2026) | $51m |
| Latest payout, annualised (ETFIQ) | 7.1% |
| Expense ratio (prospectus XBRL) | 0.39% |
| Cash paid, trailing 12 months (ETFIQ) | 19.6% |
| Launched | Mar 15, 2024 |
Every figure is an ETFIQ calculation from exchange prices and cash distributions (Tiingo end-of-day), total return with distributions reinvested. Return of capital is the issuer’s estimate. How this desk computes every figure
Questions people ask
- How much has IWMW paid over the last year?
- Over the year to Sep 4, 2026, IWMW paid 19.3% of its starting price in cash distributions, while the price fell 1.2%.
- Is IWMW ahead of IWM?
- Over the year to Sep 4, 2026, with every distribution reinvested, IWMW returned +20.4% against +26.4% for Russell 2000 (IWM), so a holder was behind it by 6.0 points.
- How often does IWMW pay, and how much?
- IWMW pays monthly. The latest distribution annualises to 7.1% at its price on Sep 4, 2026, which is not a promise; the next one can differ.
- What does IWMW cost?
- The prospectus expense ratio is 0.39% a year.
The words on this page
- Total return
- What a holder actually ended up with: price change plus every distribution, reinvested. The only figure that answers whether you came out ahead.
- Cash paid
- Distributions over the window as a share of what the fund cost at the start. A measure of cash delivered, not of return: a fund can pay a great deal and still lose money.
- Ahead or behind
- The fund’s total return minus the benchmark’s over exactly the same days, in percentage points. Both sides reinvest.
- Return of capital
- The issuer’s own estimate, in a Rule 19a-1 notice, of how much of a distribution was your own money returned. An estimate and a tax characterisation, not a measure of erosion.
- Covered call
- Selling call options on shares the fund holds. It collects a premium and gives up the gains above the strike, which is why these funds pay well and lag a rising market.
Every term this desk uses, defined in full on the income desk vocabulary page.
Where these figures came from
ETFIQ links to the documents behind every figure. It is not affiliated with any issuer, and a link is not an endorsement.
Funds near this one
Put this on your own page
The payout bar for IWMW, redrawn every trading night. Free to use with the credit link; paste these two lines into any page or newsletter.
<a href="https://etfiq.com/funds/IWMW.html"><img src="https://etfiq.com/embed/income/IWMW.svg" alt="IWMW payout bar, ETFIQ" width="640"></a>
<p><a href="https://etfiq.com/funds/IWMW.html">IWMW payout bar, updated daily by ETFIQ</a></p>Use this data, or open the live card
Open IWMW on the live ETFIQ desk, where the figures update as the desk refreshes.
Cite this page. ETFIQ, IWMW on the income desk, data as of Sep 4, 2026. https://etfiq.com/funds/IWMW.html Free to use with attribution; the underlying files are at Open data.