IDRV · iShares Self-Driving EV and Tech ETF
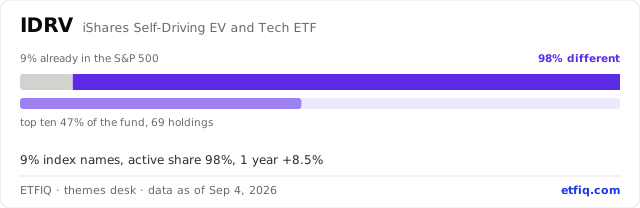
IDRV holds 69 stocks. 98% of it is not in the S&P 500, and its top ten are 47% of the fund.
Its ten largest positions
| Holding | Ticker | Weight | |
|---|---|---|---|
| SAMSUNG SDI CO., LTD. | 8.24% | ||
| ALBEMARLE CORPORATION | 5.72% | ||
| PLS GROUP LIMITED | 5.23% | ||
| ABB Ltd | 4.64% | ||
| Contemporary Amperex Technology Co., Ltd. | 3.94% | ||
| LG ENERGY SOLUTION, LTD. | 3.94% | ||
| HYUNDAI MOBIS CO.,LTD | 3.92% | ||
| BYD COMPANY LIMITED | 3.80% | ||
| LG CHEM LTD | 3.80% | ||
| NIO INC. | 3.69% |
Period by period
| Window | Total return | S&P 500 | Gap to S&P 500 | Gap to Nasdaq-100 |
|---|---|---|---|---|
| 3 months | −9.1% | +4.7% | −13.8 pts | −11.2 pts |
| 6 months | +0.7% | +15.2% | −14.4 pts | −19.4 pts |
| 1 year | +8.5% | +20.0% | −11.4 pts | −17.1 pts |
| 3 years | −1.0% | +78.0% | −79.0 pts | −94.5 pts |
| Since launch | +62.2% | +195.7% | −133.5 pts | −239.4 pts |
In plain words
The top ten holdings are 47% of the fund across 69 positions, as filed for Apr 30, 2026. Over the year to Sep 4, 2026 the fund returned +8.5% with distributions reinvested against +20.0% for the S&P 500, so a holder was behind by 11.4 pts. It sits 27.8% below its all-time high of Nov 22, 2021.
| Theme (ETFIQ, editorial) | Electric vehicles and batteries |
|---|---|
| Launched | Apr 18, 2019 |
| Already in the S&P 500, by weight (ETFIQ) | 8.8% |
| Active share vs the S&P 500 (ETFIQ) | 98.1% |
| Already in the Nasdaq-100, by weight (ETFIQ) | 3.1% |
| Active share vs the Nasdaq-100 (ETFIQ) | 96.9% |
| Top ten holdings weight | 46.9% |
| Holdings | 69 |
| Holdings as of (SEC N-PORT) | Apr 30, 2026 |
| Top holdings | SAMSUNG SDI CO., LTD. 8.2%, ALBEMARLE CORPORATION 5.7%, PLS GROUP LIMITED 5.2%, ABB Ltd 4.6%, Contemporary Amperex Technology Co., Ltd. 3.9%, LG ENERGY SOLUTION, LTD. 3.9%, HYUNDAI MOBIS CO.,LTD 3.9%, BYD COMPANY LIMITED 3.8%, LG CHEM LTD 3.8%, NIO INC. 3.7% |
| Net assets (SEC filing, whole fund, as filed for Apr 30, 2026) | $161m |
| Below its all-time high (ETFIQ) | −27.8% |
| Expense ratio (prospectus XBRL) | 0.48% |
| Fee for the part that differs from the S&P 500, active expense ratio (ETFIQ) | 0.49% |
| Closest funds by holdings overlap | FDRV 43%, KARS 36%, LIT 31%, SMOG 23%, DRIV 22% |
Holdings from the fund’s latest public SEC N-PORT filing; overlap and active share computed by ETFIQ against the IVV and QQQM books; returns from Tiingo end-of-day prices with distributions reinvested. How this desk computes every figure
Questions people ask
- How much of IDRV is already in the S&P 500?
- By its holdings filed for Apr 30, 2026, 9% of IDRV by weight is stocks the S&P 500 already holds. Its active share against the index is 98%, so that share is the part doing something different.
- What does IDRV hold?
- 69 positions as filed for Apr 30, 2026, with the top ten at 47% of the fund. The largest are SAMSUNG SDI CO., LTD. at 8.2%, ALBEMARLE CORPORATION at 5.7%, PLS GROUP LIMITED at 5.2%.
- Has IDRV beaten the S&P 500?
- Over the year to Sep 4, 2026 IDRV returned +8.5% with distributions reinvested, against +20.0% for the S&P 500, so it finished behind the index by 11.4 points.
- What does IDRV cost?
- The prospectus expense ratio is 0.48% a year. Because 98% of the fund differs from the S&P 500, the fee on that differing part works out at 0.49%.
The words on this page
- Active share
- The part of the fund doing something the index is not, as a percentage. It is the part a fee is actually buying.
- Weight overlap
- The share of money two portfolios hold in the same securities at the same weight. Above 50%, holding both is close to holding one of them twice.
- Already in the index
- The fund’s weight in securities the S&P 500 holds at all. A fund can be made entirely of index names and still have high active share, because it holds them at very different weights.
- Top ten
- What the ten largest positions add up to. The higher it is, the more the fund is a bet on a few companies rather than a theme.
Every term this desk uses, defined in full on the themes desk vocabulary page.
Where these figures came from
ETFIQ links to the documents behind every figure. It is not affiliated with any issuer, and a link is not an endorsement.
Funds near this one
Put this on your own page
The difference bar for IDRV, redrawn every trading night. Free to use with the credit link; paste these two lines into any page or newsletter.
<a href="https://etfiq.com/funds/IDRV.html"><img src="https://etfiq.com/embed/themes/IDRV.svg" alt="IDRV difference bar, ETFIQ" width="640"></a>
<p><a href="https://etfiq.com/funds/IDRV.html">IDRV difference bar, updated daily by ETFIQ</a></p>Use this data, or open the live card
Open IDRV on the live ETFIQ desk, where the figures update as the desk refreshes.
Cite this page. ETFIQ, IDRV on the themes desk, data as of Sep 4, 2026. https://etfiq.com/funds/IDRV.html Free to use with attribution; the underlying files are at Open data.