DOCT · FT Vest U.S. Equity Deep Buffer ETF - October
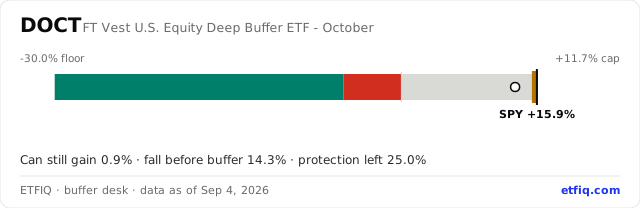
DOCT can gain 0.9% more before its cap and can fall 14.3% before its buffer engages. It resets in 42 days.
Where it sits today
SPY has returned +15.9% since this period started on Oct 20, 2025, which puts DOCT above its cap. The buffer runs from −5.0% to −30.0% and the cap sits at +11.7%, both in SPY terms. Green is the buffered zone, amber is past the cap, red is loss below the floor.
Period by period
| Window | Total return | SPY | Gap to SPY |
|---|---|---|---|
| 3 months | +3.3% | +4.7% | −1.4 pts |
| 6 months | +8.5% | +15.2% | −6.7 pts |
| 1 year | +12.5% | +20.0% | −7.5 pts |
| 3 years | +34.7% | +78.0% | −43.3 pts |
In plain words
The fund's own price can still drift up to about 0.9% as the period runs out. The fund's price can fall 14.3% from here before the buffer starts absorbing losses, by the issuer's figure. In index terms, SPY can fall 18.0% from today's level to the point where the buffer begins. Protection left, in index points: 25.0% of the 25.0% buffer still sits below today's SPY level. 42 days remained on Sep 4, 2026. On Oct 16, 2026 the period ends and a new cap is set.
| Reference index | SPY |
|---|---|
| Buffer | |
| Outcome period | Oct 20, 2025 to Oct 16, 2026 |
| Starting cap | +11.7% |
| SPY return since period start | +15.9% |
| Fund return since period start | +9.8% |
| Net assets (issuer page, as of Sep 4, 2026) | $395m |
| Band state today (ETFIQ) | At cap |
| Can still gain (issuer, fund price) | 0.9% |
| Fall before buffer (issuer, fund price) | 14.3% |
| Fall to the buffer in index terms (ETFIQ) | 18.0% |
| Protection left in index points (ETFIQ) | 25.0% of 25.0% |
| Days left in period | 42 |
| Expense ratio | 0.85% |
Issuer-published figures as of the date shown; ETFIQ calculations marked. Definitions on the learn page. How this desk computes every figure
Questions people ask
- How much can DOCT still gain?
- Nothing more in index terms on Sep 4, 2026. SPY has already passed the cap of +11.7% for this period, which runs from Oct 20, 2025 to Oct 16, 2026.
- How far can DOCT fall before the buffer helps?
- 14.3% in fund-price terms on Sep 4, 2026, by the issuer's figure. In index terms SPY can fall 18.0% from that level before the buffer begins. Losses until that point are the holder's.
- How much of the DOCT buffer is left?
- 25.0% of the 25.0% buffer sat below the SPY level on Sep 4, 2026. That is an ETFIQ calculation in index points, on one definition for every issuer.
- When does DOCT reset?
- The outcome period ends on Oct 16, 2026, 42 days from the data on Sep 4, 2026. A new cap is set the next day and the buffer starts again.
- What does DOCT cost?
- The prospectus expense ratio is 0.85% a year.
The words on this page
- Buffer
- The first slice of loss the fund absorbs for you over its outcome period, stated on the reference index. A 15% buffer means the index can fall 15% before you take any of it.
- Cap
- The most the fund can return over the period, however far the index rises. It is the price paid for the buffer.
- Outcome period
- The window the buffer and cap apply over, usually a year. Both are set at the start and only hold if you are there for the whole of it.
- Reset
- The day one outcome period ends and the next begins, with a fresh buffer and a fresh cap struck at that day’s level.
- Protection left
- The part of the buffer still below today’s index level. A buffer bought mid-period is not the full buffer; this is what is left of it.
Every term this desk uses, defined in full on the buffer desk vocabulary page.
Where these figures came from
ETFIQ links to the documents behind every figure. It is not affiliated with any issuer, and a link is not an endorsement.
Compare DOCT
Funds near this one
Put this on your own page
The outcome band for DOCT, redrawn every trading night. Free to use with the credit link; paste these two lines into any page or newsletter.
<a href="https://etfiq.com/funds/DOCT.html"><img src="https://etfiq.com/embed/buffer/DOCT.svg" alt="DOCT outcome band, ETFIQ" width="640"></a>
<p><a href="https://etfiq.com/funds/DOCT.html">DOCT outcome band, updated daily by ETFIQ</a></p>Use this data, or open the live card
Open DOCT on the live ETFIQ desk, where the figures update as the desk refreshes.
Cite this page. ETFIQ, DOCT on the buffer desk, data as of Sep 4, 2026. https://etfiq.com/funds/DOCT.html Free to use with attribution; the underlying files are at Open data.