Data as of . Holdings from the fund’s latest public SEC N-PORT filing; overlap and active share computed by ETFIQ against the IVV and QQQM books; returns from Tiingo end-of-day prices with distributions reinvested.
AOTG · AOT Growth and Innovation ETF
not published · Themes desk
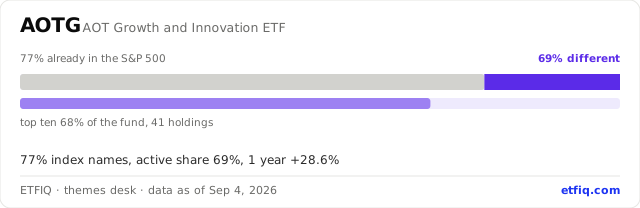
Open the live card on ETFIQBy weight, 77% of AOTG's portfolio is stocks that are also in the S&P 500; its active share against the S&P 500 is 69%. The top ten holdings are 68% of the fund across 41 positions, as filed for May 29, 2026. Over the year to Sep 4, 2026 the fund returned +28.6% with distributions reinvested against +20.0% for the S&P 500, so a holder was ahead by 8.7 pts.
| Theme (ETFIQ, editorial) | Broad innovation and megatrends |
|---|---|
| Launched | Jun 29, 2022 |
| Already in the S&P 500, by weight (ETFIQ) | 77.4% |
| Active share vs the S&P 500 (ETFIQ) | 69.1% |
| Already in the Nasdaq-100, by weight (ETFIQ) | 67.7% |
| Active share vs the Nasdaq-100 (ETFIQ) | 60.4% |
| Top ten holdings weight | 68.4% |
| Holdings | 41 |
| Net assets (latest filing) | $105M |
| Holdings as of (SEC N-PORT) | May 29, 2026 |
| Top holdings | Advanced Micro Devices Inc 15.4%, NVIDIA Corp 10.5%, Micron Technology Inc 9.5%, Taiwan Semiconductor Manufacturing Co Ltd 6.8%, AppLovin Corp 5.3%, Toast Inc 4.7%, Amazon.com Inc 4.4%, Alphabet Inc 4.1%, Microsoft Corp 4.0%, Robinhood Markets Inc 3.8% |
| 3 months: total return / S&P 500 / gap / Nasdaq-100 gap (ETFIQ) | +9.4% / +4.7% / +4.7 pts / +7.3 pts |
| 6 months: total return / S&P 500 / gap / Nasdaq-100 gap (ETFIQ) | +33.1% / +15.2% / +17.9 pts / +12.9 pts |
| 1 year: total return / S&P 500 / gap / Nasdaq-100 gap (ETFIQ) | +28.6% / +20.0% / +8.7 pts / +3.0 pts |
| 3 years: total return / S&P 500 / gap / Nasdaq-100 gap (ETFIQ) | +111.8% / +78.0% / +33.9 pts / +18.4 pts |
| since launch: total return / S&P 500 / gap / Nasdaq-100 gap (ETFIQ) | +170.2% / +113.7% / +56.6 pts / +10.7 pts |
| Below its all-time high (ETFIQ) | −0.1% |
| Expense ratio (prospectus XBRL) | 0.75% |
| Fee for the part that differs from the S&P 500, active expense ratio (ETFIQ) | 1.09% |
| Closest funds by holdings overlap | IVES 45%, FRWD 44%, ALAI 42%, ILDR 41%, FAI 39% |
Questions people ask
- How much of AOTG is already in the S&P 500?
- By its holdings filed for May 29, 2026, 77% of AOTG by weight is stocks the S&P 500 already holds. Its active share against the index is 69%, so that share is the part doing something different.
- What does AOTG hold?
- 41 positions as filed for May 29, 2026, with the top ten at 68% of the fund. The largest are Advanced Micro Devices Inc at 15.4%, NVIDIA Corp at 10.5%, Micron Technology Inc at 9.5%.
- Has AOTG beaten the S&P 500?
- Over the year to Sep 4, 2026 AOTG returned +28.6% with distributions reinvested, against +20.0% for the S&P 500, so it finished ahead of the index by 8.7 points.
- What does AOTG cost?
- The prospectus expense ratio is 0.75% a year. Because 69% of the fund differs from the S&P 500, the fee on that differing part works out at 1.09%.
Where these figures came from
ETFIQ links to the documents behind every figure. It is not affiliated with any issuer, and a link is not an endorsement.
Funds near this one
Put this on your own page
The difference bar for AOTG, redrawn every trading night. Free to use with the credit link; paste these two lines into any page or newsletter.
<a href="https://etfiq.com/funds/AOTG.html"><img src="https://etfiq.com/embed/themes/AOTG.svg" alt="AOTG difference bar, ETFIQ" width="640"></a>
<p><a href="https://etfiq.com/funds/AOTG.html">AOTG difference bar, updated daily by ETFIQ</a></p>
Cite this page. ETFIQ, AOTG on the themes desk, data as of Sep 4, 2026. https://etfiq.com/funds/AOTG.html Free to use with attribution; the underlying files are at Open data.
ETFIQ is an independent publisher of exchange-traded fund data. It is not a fund issuer, broker-dealer or investment adviser, and it makes no recommendations; sort orders and figures are stated arithmetic on published data. Standards · How to read this desk